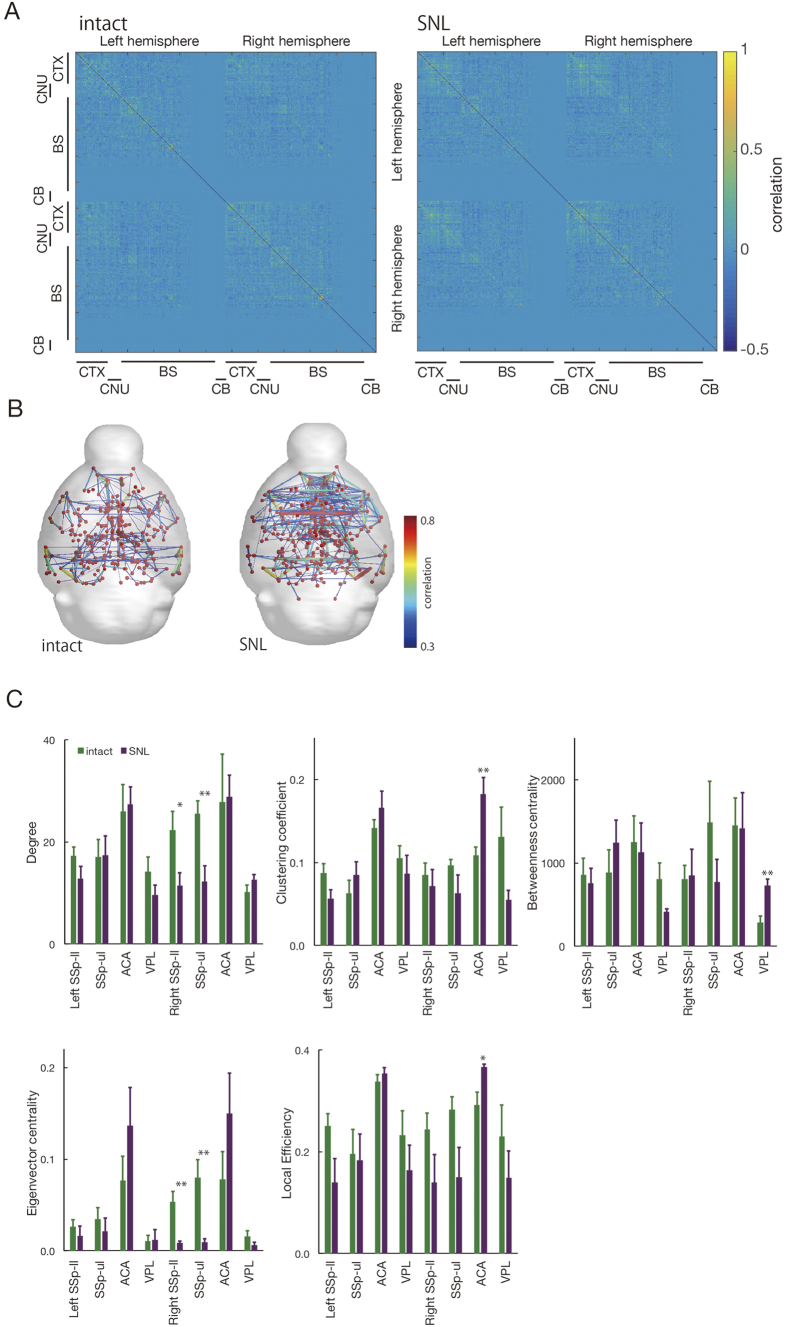
Figure 5. Visualization and graph theory analysis of brain networks in the peripheral nerve injury model mice with resting state functional connectivity MRI.
(A) A connection matrix was expressed in terms of the temporal correlations between 576 architectonic subdivisions in the intact and spinal nerve ligation (SNL) mouse whole brain. Vertical and horizontal axes indicate the identification number of ROIs. The color bar shows the correlation between ROIs. (B) Brain networks were visualized in terms of 576 nodes and edges based on a connection matrix. (C) Characteristics of the brain network as calculated by a graph theory approach. Green, intact (preoperation); magenta, peripheral nerve injury. Paired t-test (*p < 0.05, **p < 0.001).

