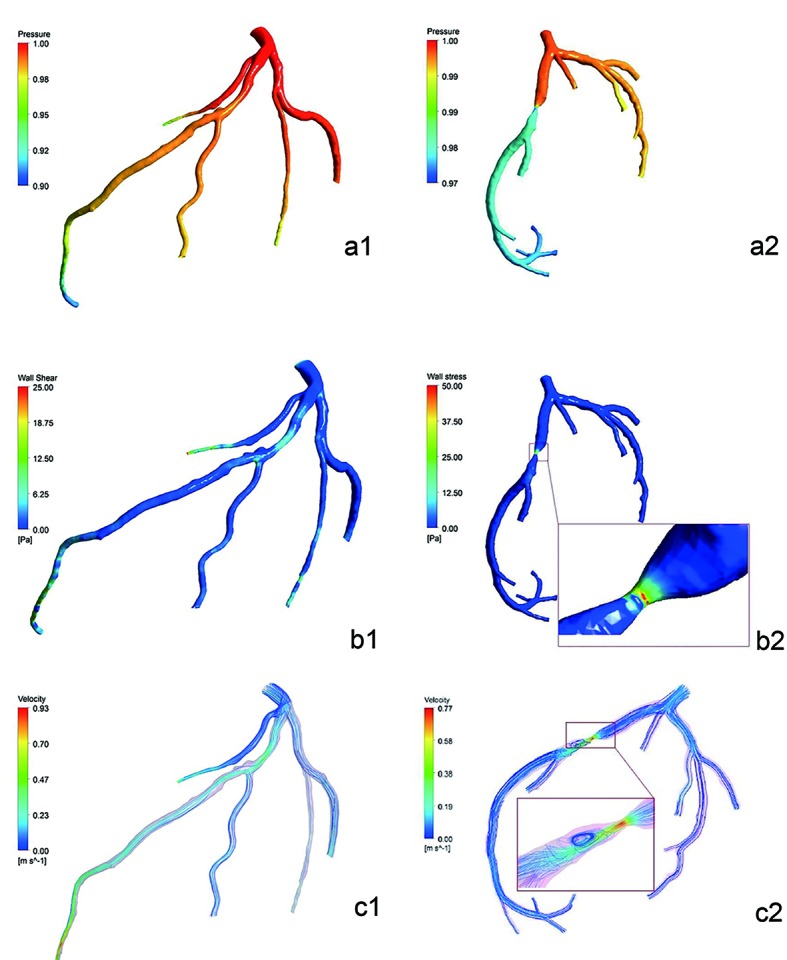
Figure 5.

Pressure distribution simulated diagram of cases 2 and 3 (the entry was one) (a1-a2). There was little descending in the pressure gradient of case 2. But the descending in the color difference which was pressure gradient of case 3 between proximal and distal of stenosis of LAD was large. Noteworthy reduction of pressure was observed in the distal segment of left septal branch of case 2. It showed the WSS distribution simulated diagram of cases 2 and 3 (Pa) (b1-b2). WSS values in lumen without plaques or stenosis were low and uniform. At regions opposite to the flow divider, dominant low WSS values occurred. In case 3, WSS values of severe stenosis were higher. It showed the flow velocity distribution simulated diagram of cases 2 and 3 (m/s) (c1-c2). Blood flow velocity distributed uniformly in the LAD, and center axial flow was faster than border flow. Blood flow velocity gradient barely changed in the stenosis segment of case 2. But there was obvious variation in LAD of case 3: acceleration of flow velocity on both ends of stenosis, the fastest flow velocity in the center of stenosis, obvious turbulence after end of stenosis.
