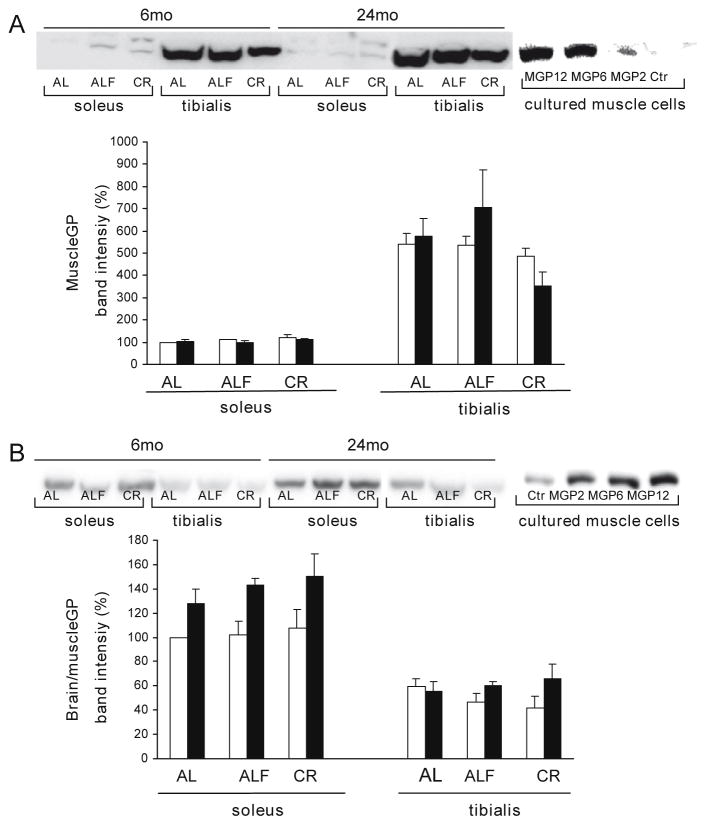
Fig. 3.
Immunoblot analysis of muscle and brain/muscle GP protein content. Western blot analyses were performed on total extracts from SOL and TA muscle samples (20 μg of protein) and on extracts from cultured human muscles cells transfected with an adenovirus encoding GFP (Ctr) or an adenovirus encoding rabbit muscle GP cDNA (MGP) at increasing multiplicity of infection (10×) (20 μg (A) or 5 μg (B) of protein). Membranes hybridized with antibodies against (A) muscle GP, (B) brain/muscle GP. For each age group, muscle and dietary treatment a representative image is shown and bands were quantified with a LAS-3000 (FujiFilm). Means ± SEM from at least 5 rats for each group are shown. Data were compared using percentages with the mean value of the young AL group in the SOL Age influenced the brain/muscle GP protein in SOL (F 14.8, p < 0.001). The significance of Student’s t-test for muscle and brain/muscle GP protein in TA versus SOL muscle is p < 0.0001.

