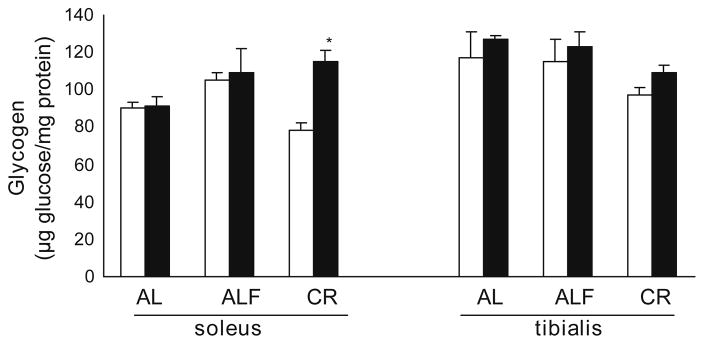
Fig. 4.
Glycogen content. Glycogen content was measured in extracts from SOL and TA muscles. Means ± SEM from at least 5 rats for each group are shown. There was an influence of diet (F 4.0, p < 0.05). The interaction of diet and age was also significative (F 4.4, p < 0.05) in SOL The significance of differences is versus young rats comparing equivalent diet and muscle *p < 0.05.

