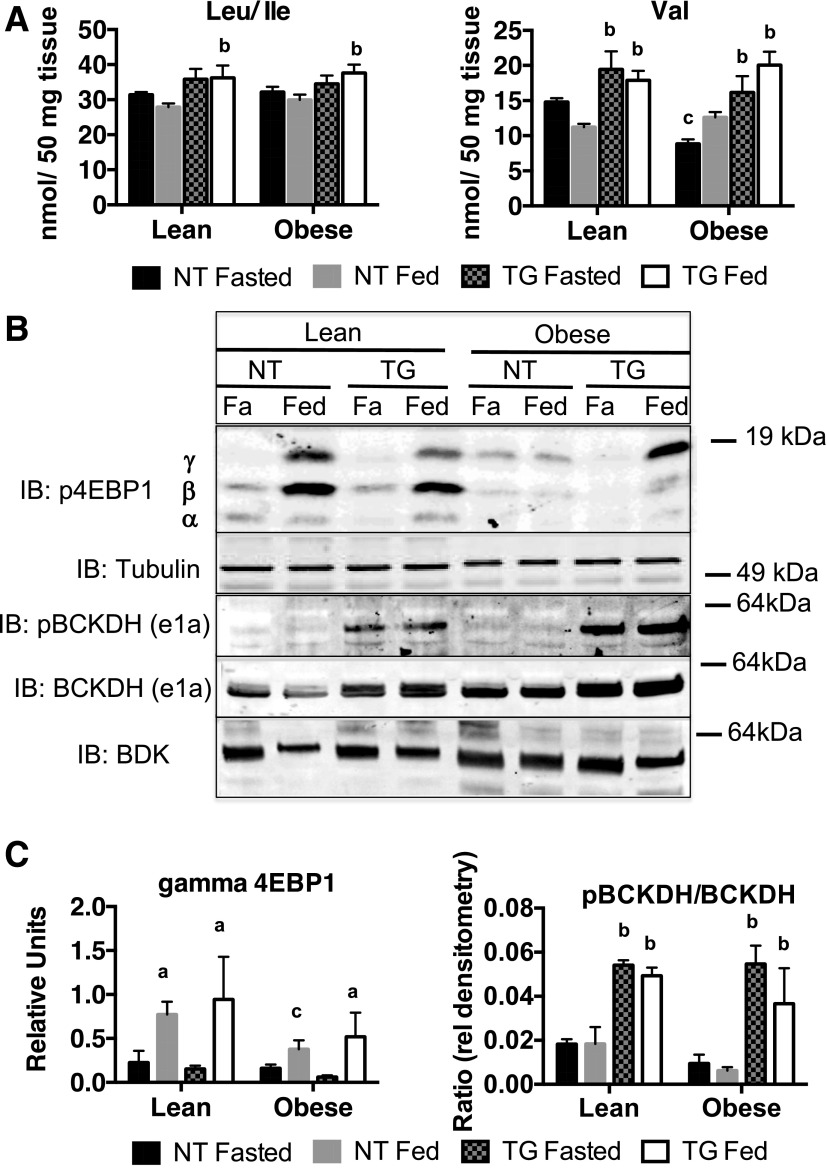
Figure 4.
Skeletal muscle BCAAs and 4E-BP1 hyperphosphorylation in fasted (Fa) and fed NT and hGLUT4 TG mice fed a CD (Lean) or an HFD (Obese) for 5 weeks. A: BCAA data are the mean and SEM for five animals per group. B: Representative Western blot immunoblotted (IB) for 4E-BP1 hyperphosphorylation, phospho-BCKDH (pBCKDH) and total BCKDH e1a, and BDK from whole-cell skeletal muscle extracts. C: Quantification of hyperphosphorylated (γ) 4EBP1 and the ratio of phospho-BCKDH to total BCKDH. Data are the mean and SEM of the relative densitometry units for the analysis of three independent muscle extracts for each group. Data were analyzed by two-way ANOVA. Pairwise comparisons of 95% CIs established significant differences (P < 0.05) between groups. The letter “a” designates a significant difference due to nutritional state (fasted or fed) for a given strain (NT or TG) or body mass (Lean or Obese). The letter “b” designates a significant difference due to strain for a given nutritional state or body mass. The letter “c” indicates a significant difference due to body mass for a given nutritional state or strain.

