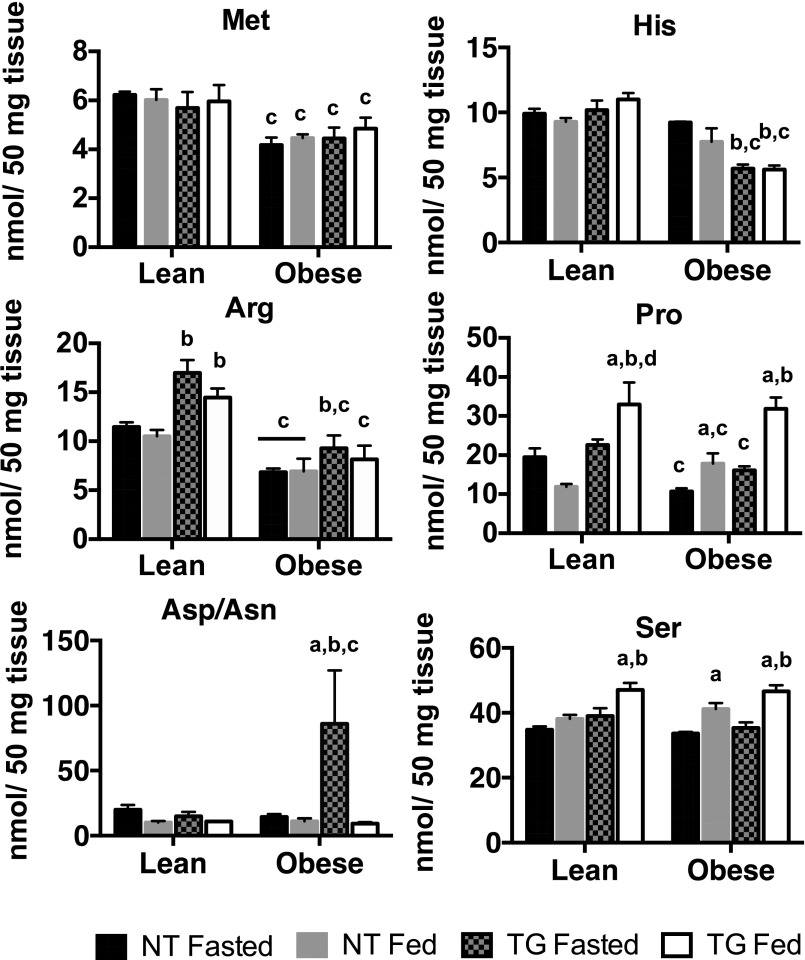
Figure 6.
Amino acids in fasted and fed skeletal muscle of NT and hGLUT4 TG mice fed a CD (Lean) or an HFD (Obese) for 5 weeks. Data are the mean and SEM for five animals per group. Data were analyzed by two-way ANOVA. Pairwise comparisons of 95% CIs established significant differences (P < 0.05) between groups. The letter “a” designates a significant difference due to nutritional state (fasted or fed) for a given strain (NT or TG) or body mass (Lean or Obese). The letter “b” designates a significant different due to strain for a given nutritional state or body mass. The letter “c” indicates a significant difference due to body mass for a given nutritional state or strain.

