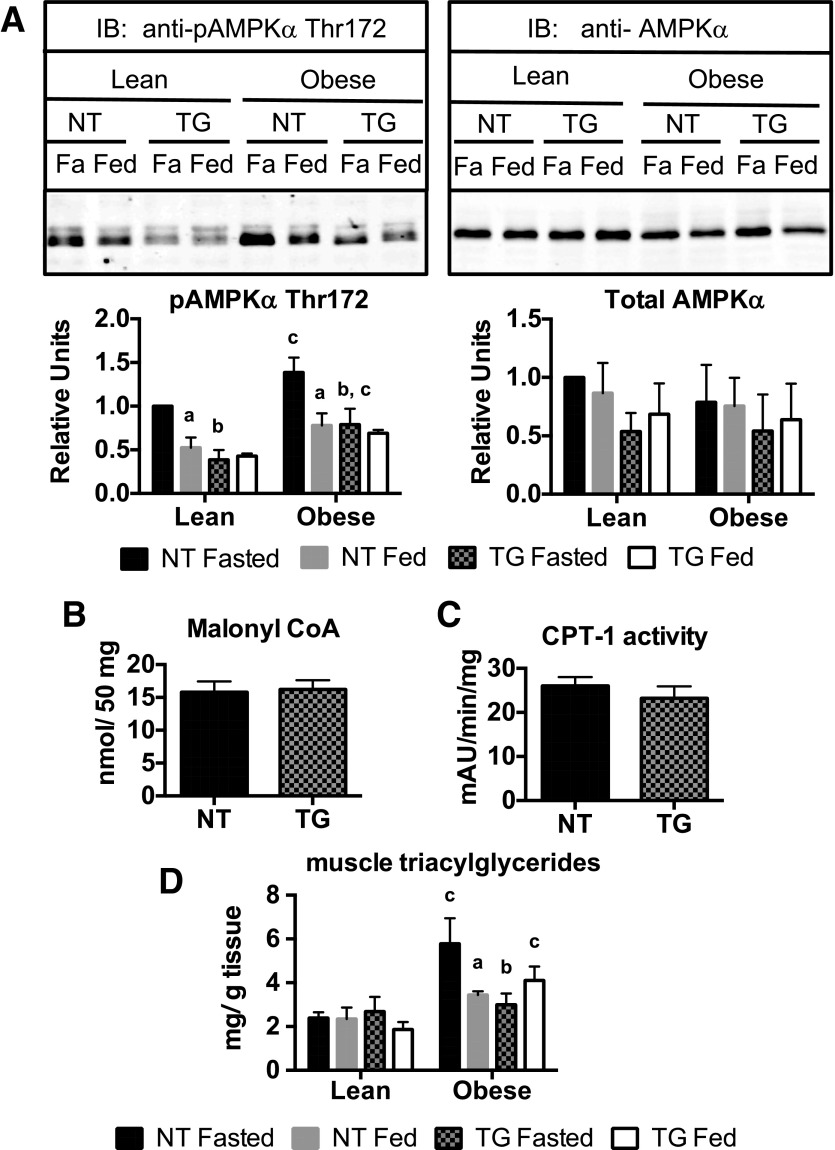
Figure 8.
Skeletal muscle AMPK activation, malonyl CoA levels, CPT-1 activity, and TAGs in fasted (Fa) and fed NT and hGLUT4 TG mice fed a CD (Lean) or an HFD (Obese) for 5 weeks. A: Representative Western blot analysis and quantification of immunoblots (IB) for phospho-AMPK and total AMPK levels from whole-cell skeletal muscle extracts. Data are the mean and SEM of the relative densitometry units for analysis of three independent muscle extracts for each group. Malonyl CoA levels (B), CPT-1 activity (C), and muscle triacylglyceride levels (D) are all the mean and SEM for four independent measurements. Data for phospho-AMPK and total AMPK and triacylglycerides were analyzed by two-way ANOVA. Pairwise comparisons of 95% CIs established significant differences (P < 0.05) between groups. The letter “a” designates a significant difference due to nutritional state (fasted or fed) for a given strain (NT or TG) or body mass (Lean or Obese). The letter “b” designates a significant difference due to strain for a given nutritional state or body mass. The letter “c” indicates a significant difference due to body mass for a given nutritional state or strain. Data for malonyl CoA and CPT-1 activity were analyzed by two-tailed t test.

