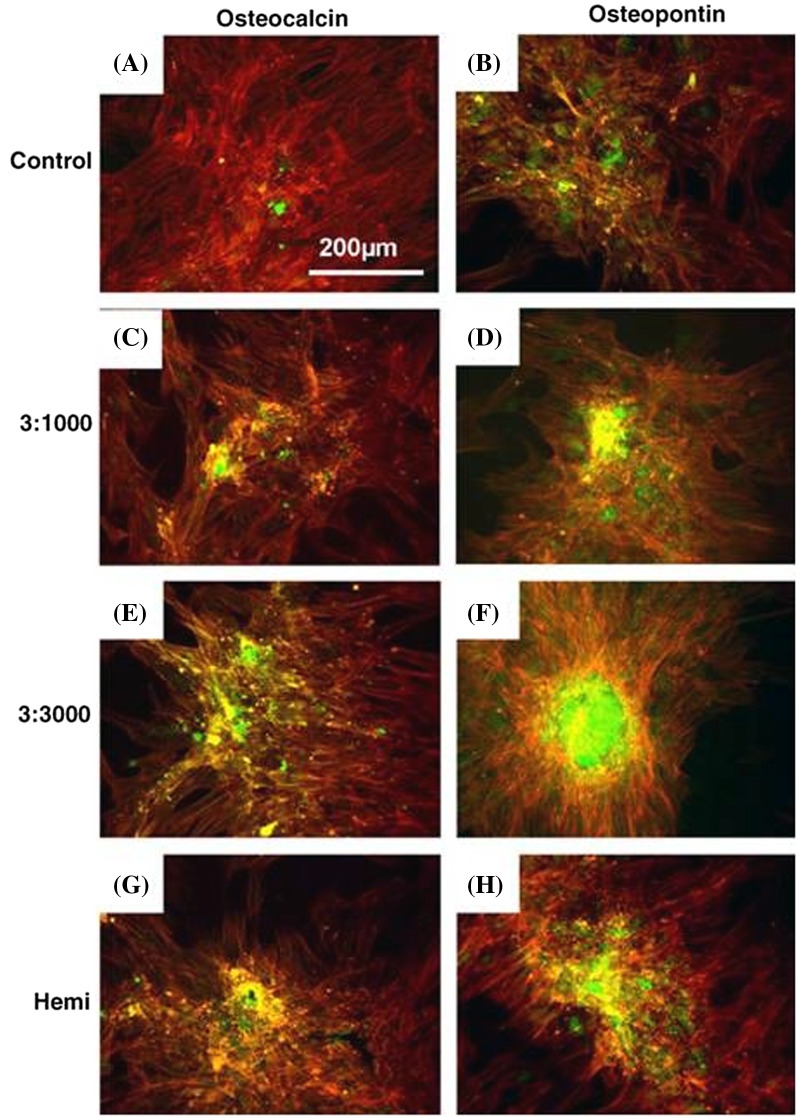
Figure 5.
Osteocalcin (OCN) and osteopontin (OPN) fluorescence images of HMSCs cultured on control and test materials. Cells on planar control formed confluent layers but very little OCN or OPN stained was observed on day 21. Bone nodule formation can be seen on 3:1000. (Note: red = actin, green = OCN/OPN). Images reproduced with permission from [47].

