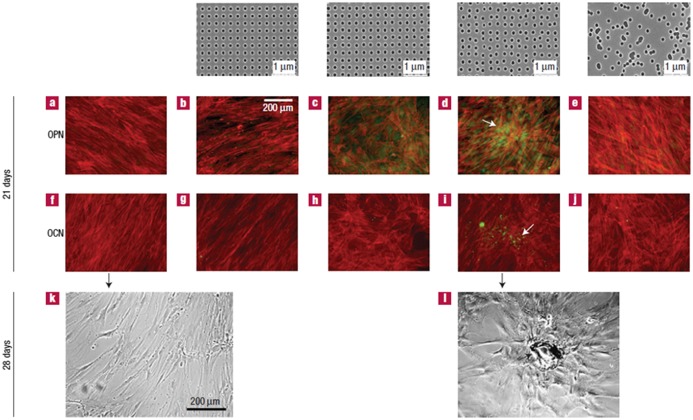
Figure 6.
The topmost row shows the images of nanotopographies fabricated by electron beam lithography (EBL). All the pits are 120 nm in diameter, 100 nm deep and have average 300 nm center–center spacing with square, displaced square 20 (±20 nm from true center), displaced square 50 (±50 nm from true center) and random arrangements. (a, f) MSC with fibroblastic appearance and absence of OPN or OCN positive cells on the control, (b, g) no OPN or OCN positive cells on SQ, (c, h) OPN positive cells but no OCN positive cells on DSQ 20, (d, i) OPN and OCN positive cells and nodule formation (arrows) on DSQ 50, (e, j) MSC with osteoblastic morphology and absence of OPN or OCN positive cells on RAND, (k) MSCs with fibroblastic morphology on control after 28 days of culture and (l) mature bone nodules on DSQ 50 after 28 days of culture. Images reproduced with permission from [49].

