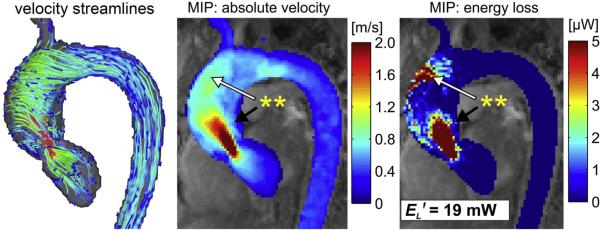
Fig. 1.
Systolic velocity streamlines (left), maximum intensity projection (MIP) of the 3-dimensinal (3D) velocity field (middle), and viscous dissipation (right) in the thoracic aorta of a patient with borderline severe stenosis (peak systolic velocity of 4.0 m/s). Regionally high velocity gradients (double asterisk, black arrow) result in elevated energy loss. Flow jet impingement at the aortic wall (double asterisk, white arrow) is co-located with a region of substantial energy loss. EL', cumulative peak systolic energy loss in the ascending aorta. (Courtesy of A. Barker, PhD, and P. van Ooij, PhD, Northwestern University, Chicago, IL.)

