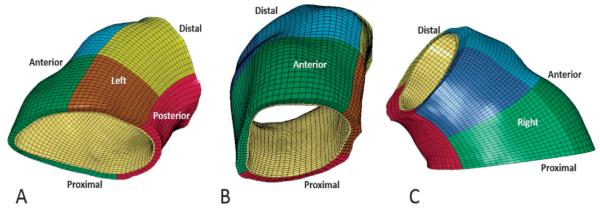
Figure 3.
The aTAA mesh. A) Left inferior view; the red region is posterior, brown and yellow regions are proximal and distal left, respectively. B) Anterior view; the green and blue regions are proximal and distal anterior, respectively. C) Right lateral view; the light green and dark blue regions are proximal and distal right, respectively.

