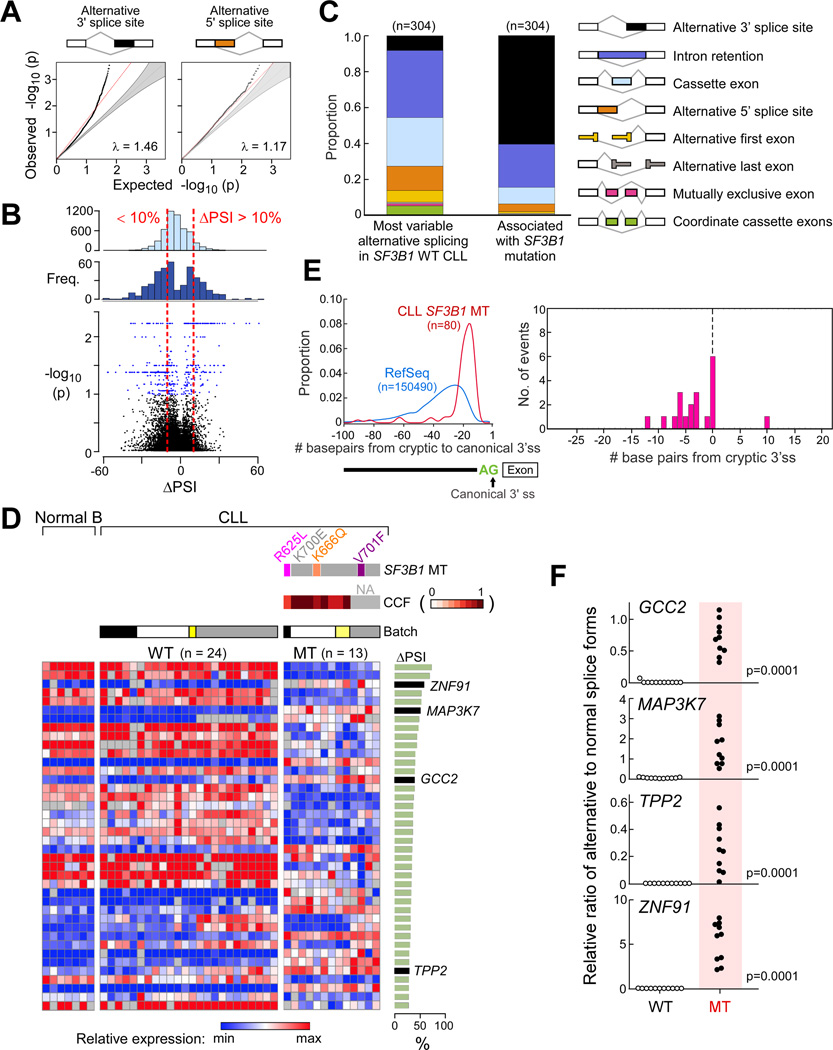
Figure 1. SF3B1 mutation is associated with alternative splicing at 3’ splice sites in CLL.
(A) Q–Q plots comparing observed empirical with expected p values between SF3B1 wild-type and mutated CLL identified through the analysis of bulk poly-A selected RNA-seq from 37 CLLs. Red line - the least-squares linear fit to the lower 95 percentile of points with slope λ. Grey-shaded areas - 95% confidence intervals for the expected distribution.
(B) Frequency of ΔPSI from random comparisons (top) or significant splice changes (middle, p<0.05) from the RNA-Seq data above and volcano plot of ΔPSI versus log10(p) of all splicing changes (bottom). Red dotted lines - thresholds of ΔPSI of 10%. Blue dots -significant splicing events.
(C) Categories of alternative splicing within the 304 splice events significantly associated with mutant SF3B1 in CLL vs. the 304 most variable alternatively spliced events in wild-type CLL from bulk poly-A selected RNA-seq.
(D) Heat map of the top 40 alternatively spliced events with the highest ΔPSI between CLL samples with mutant (n=13) and wild-type (n=24) SF3B1. Expression of splice variants from RNA-seq analysis of CD19+ selected B cells from 7 healthy adult volunteers indicated, along with RNA-seq batch labels, SF3B1 mutation type and clonality status. Right panel - ΔPSI for each splice event.
(E) Left-Density plot of the positions of cryptic AGs relative to their canonical splice sites in SF3B1 mutant samples, compared to the distance to the first AG (non-GAG trimer) from all RefSeq canonical 3’ splice sites. Right-Relative positions of mapped branchpoints (BP) (n = 16) from Mercer et al. X axis - distance in nucleotides (nt) of the BP to the cryptic AG (upstream positions are negative distances); Y axis - the frequency of BP found at that position.
(F) Validation of RNA-seq analysis through quantitative PCR of selected significantly altered spliced events in independent CLL samples (11 with wild-type (WT) and 10 with mutated (MT) SF3B1).
See also Figure S1.

