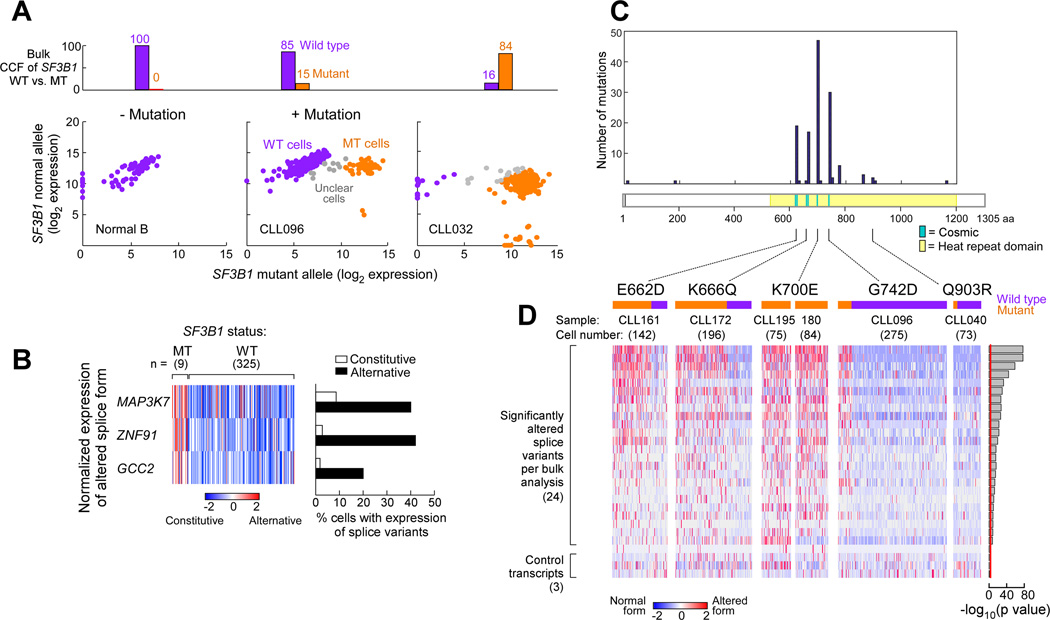
Figure 3. Single CLL cells with SF3B1 mutation express alternatively spliced RNAs.
(A) Example of SF3B1 mutation call in single normal B cells and from CLL cells from samples with either subclonal (CLL096) or clonal (CLL032) SF3B1 mutation. Log2 transformed expression of mutant vs wild-type SF3B1 alleles are plotted, with each dot representing one single cell. Purple - cells identified to be SF3B1 wild-type; Orange - cells inferred to be SF3B1 mutant; Grey - cells with ambiguous calls.
(B) Expression of alternative vs. constitutive transcript relative to total expression of the genes MAP3K7, ZNF91 and GCC2 from single cells of sample CLL096.
(C) Frequency of mutations in SF3B1 at different mutation sites from a recent study of 538 CLL samples (Landau et al., 2015). Yellow shading - heat repeat region; Blue - mutation sites previously reported from the COSMIC database.
(D) Single cell profiling of splice variant expression across 5 SF3B1 mutations from 6 CLL samples (one cell per column). Expression of the alternative transcript relative to total gene expression in 24 selected genes, identified from the bulk poly-A RNA-seq analysis, was scored along with 3 control genes. Orange and purple bars indicate cells with and without mutation, respectively.

