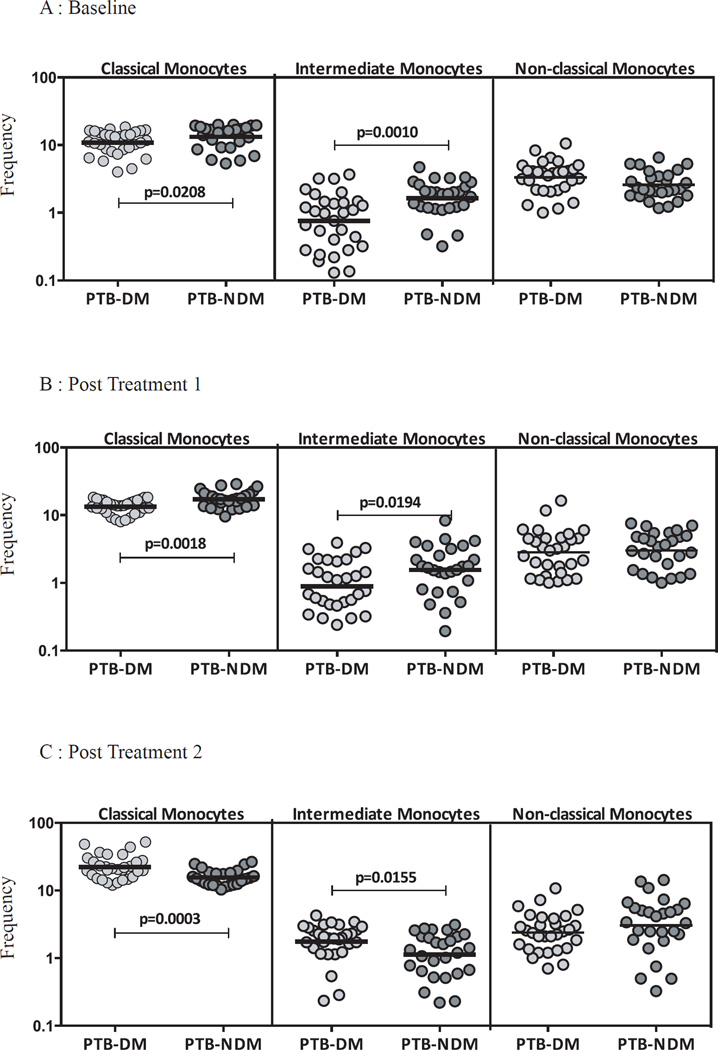
Figure 2. PTB-DM is associated with altered frequencies of monocyte subsets at baseline and following treatment.
The frequencies of monocyte subsets in PTB-DM (n=30) and PTB-NDM (n=27) individuals at baseline (A) and at two (B) and six (C) months following treatment. The data are represented as scatter plots with each circle representing a single individual. P values were calculated using the Mann-Whitney test.

