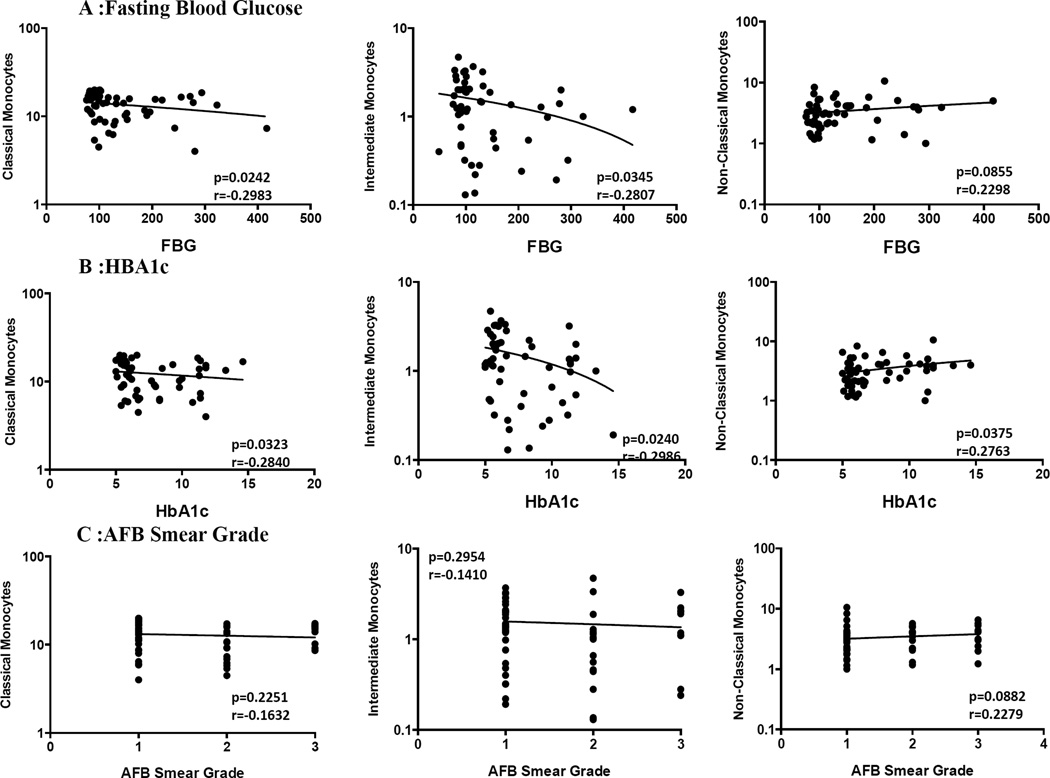
Figure 4. Relationship between monocyte cell subsets and hyperglycemia or bacterial burdens in PTB individuals.
(A) The correlation between the frequencies of monocyte subsets and fasting blood glucose levels at baseline in all individuals. (B) The correlation between the frequencies of monocyte subsets and HbA1c levels at baseline in all individuals. (C) The correlation between the frequencies of monocyte subsets and bacterial burdens as determined by smear grades (1+, 2+ or 3+) in all individuals. The data are represented as scatter plots with each circle representing a single individual. P values were calculated using the Spearman Rank correlation.

