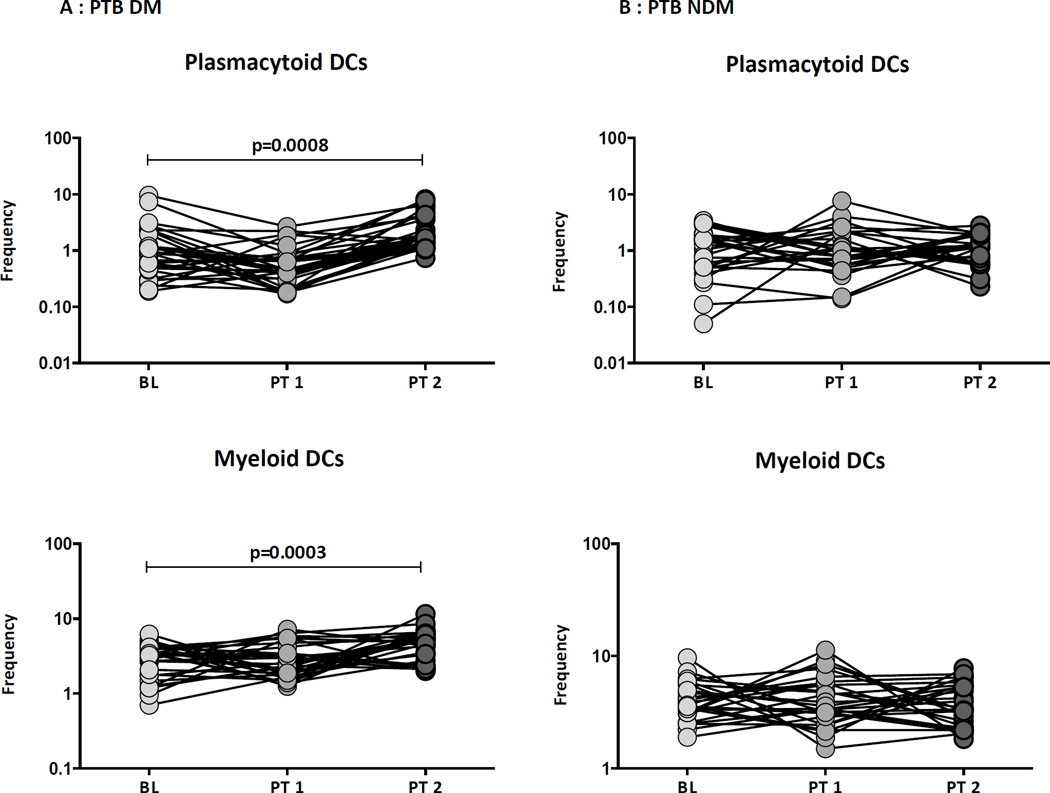
Figure 5. Treatment induced alterations in dendritic cell subsets in PTB individuals.
The frequencies of DC subsets in (A) PTB- DM and (B) PTB-NDM individuals before and at 2 and 6 months following anti-TB treatment. The data are represented as line diagrams with each line representing a single individual. P values were calculated using the Wilcoxon signed rank test.

