
Figure 7. Assessment of aortic stenosis severity by Doppler-echocardiography.
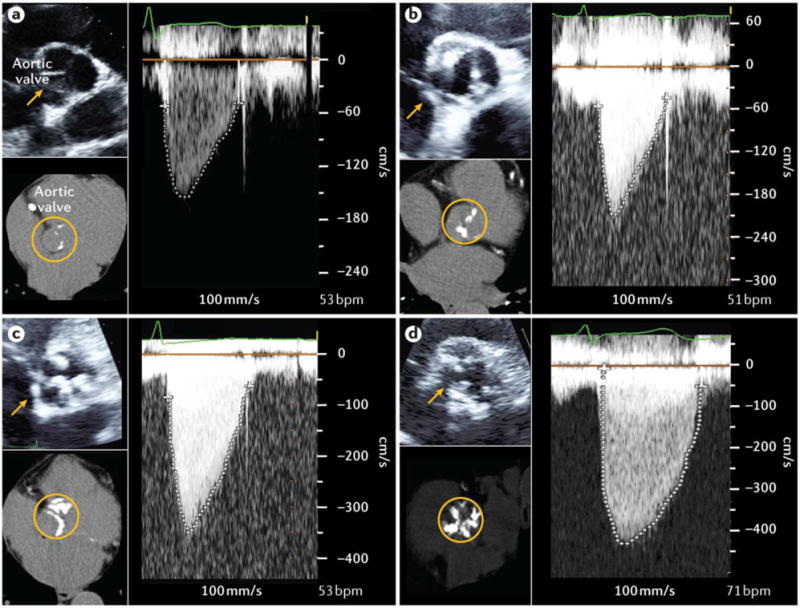
For each degree of disease severity including aortic valve sclerosis (A), mild aortic stenosis (AS) (B), moderate AS (C), and severe AS (D), this figure shows a 2D echocardiographic short-axis view of the aortic valve (top left), the transvalvular velocity by continuous-wave Doppler (right), and the multidetector computed tomography (MDCT) view of aortic valve calcification (bottom left). In the patient with aortic sclerosis (A), there are some small isolated spots of calcification (appears white on the MDCT images) in the aortic valve leaflets but there is no obstruction to blood flow (i.e. no stenosis). The peak aortic jet velocity (1.47 m/s), mean gradient (5 mmHg) and aortic valve area (AVA: 2.87 cm2) are normal. In the patient with mild AS (B), there is mild aortic valve calcification with mild obstruction to blood flow. The peak aortic jet velocity is 2.08 m/s, mean gradient: 9 mmHg, and AVA: 1.62 cm2. In the patient with moderate AS (C), there is more extensive aortic valve calcification with moderate obstruction of blood flow: peak aortic jet velocity: 3.51 m/s, mean gradient: 28 mmHg, and AVA: 1.21 cm2. In the patient with severe AS (D), there is severe aortic valve calcification and severe obstruction to blood flow: peak aortic jet velocity: 4.35 m/s, mean gradient: 48 mmHg, and AVA: 0.75 cm2.