
Figure 8. Assessment of aortic valve mineralization activity by positron emission tomography – computed tomography.
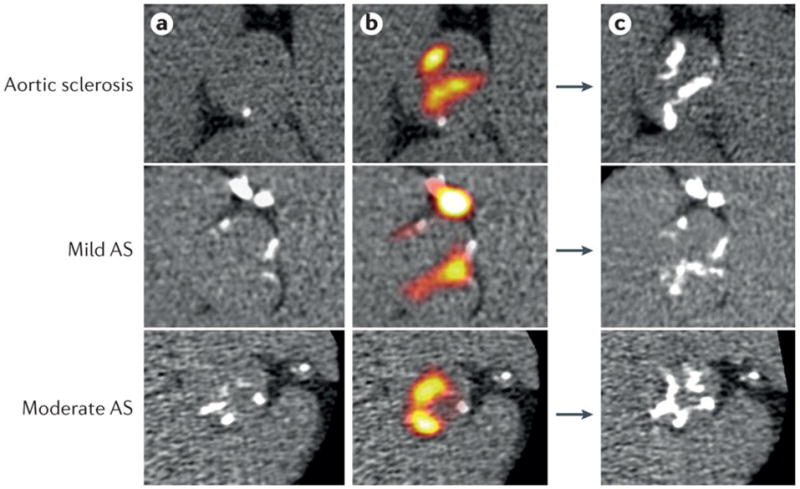
Coaxial short axis views of the aortic valve from one patient with aortic sclerosis, one patient with mild aortic stenosis and one patient with moderate aortic stenosis. Left panels: baseline multi-detector computed tomography (MDCT) images of the aortic valve; regions of macrocalcification appear white. Middle panels: baseline fused MDCT and 18F-sodium fluoride (NaF) positron emission tomography (PET) images showing intense 18F-NaF uptake (red yellow areas) both overlying and adjacent to existing calcium deposits on the MDCT. Right panels: One-year follow-up (without intervention) MDCT images demonstrate increased calcium accumulation in much the same distribution as the baseline PET activity. Reproduced with permission from172.