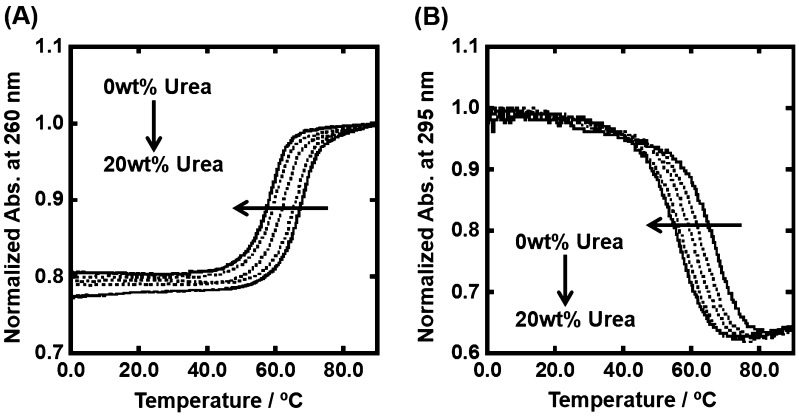
Figure 3.
Normalized UV melting curves for 5 μM dsDNA (A) and gqDNA (B) in the buffer containing 100 mM KCl, 10 mM K2HPO4, and 1 mM K2EDTA with various concentrations of urea (0, 5, 10, 15, and 20wt%). UV melting curves of dsDNA and gqDNA were assessed by UV absorbance at 260 nm and 295 nm, respectively.

