Fig. 4.
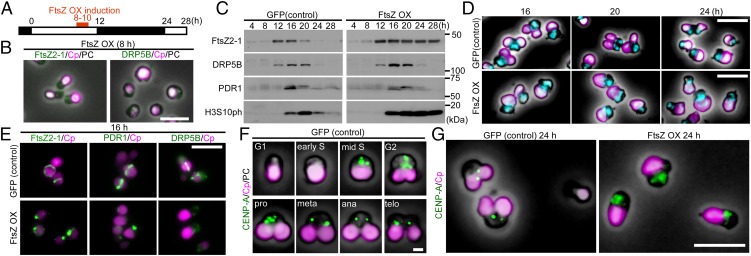
Effect of FtsZ2-1 overexpression before the onset of chloroplast division on chloroplast division and cell-cycle progression in synchronously cultured C. merolae. (A) Schematic diagram of the culture conditions. The control GFP heat-inducible (GFP) or FtsZ heat-inducible (FtsZ OX) cells were synchronized by a 12-h/12-h light/dark cycle at 42 °C and were heat shocked at 50 °C at hour 8 (just before the formation of the FtsZ ring and the onset of chloroplast division) for 2 h. (B) Immunofluorescent images of FtsZ OX cells at hour 8 (just before the induction of FtsZ by heat shock) in the synchronous culture treated with the anti–FtsZ2-1 or DRP5B antibodies. Magenta, autofluorescence of the chloroplast; green, FtsZ2-1 or DRP5B. The images obtained by fluorescence and phase-contrast microscopy are overlaid. (Scale bar: 5 μm.) (C) Immunoblot analyses showing the change in the levels of the chloroplast-division proteins FtsZ2-1, DRP5B, and PDR1 and the M-phase marker H3S10ph in GFP and FtsZ OX cells. GFP and FtsZ OX samples were blotted on the same membrane. (D) Microscopic images of DAPI-stained GFP and FtsZ OX cells at 16, 20, and 24 h in synchronous culture. Magenta, autofluorescence of the chloroplast; cyan, DNA stained with DAPI. The images obtained by fluorescence and phase-contrast microscopy are overlaid. (Scale bars: 5 μm.) (E) Immunofluorescent images of the control GFP and FtsZ OX cells at hour 16 in the synchronous culture showing FtsZ2-1, PDR1, and DRP5B localization. Magenta, autofluorescence of the chloroplast; green, immunostained FtsZ2-1, PDR1, or DRP5B. (Scale bar: 5 μm.) (F) Immunofluorescent images of the control GFP cells showing changes in the level and localization of CENP-A during cell-cycle progression. The cell-cycle stage was defined based on the cell shape according to ref. 25. The fluorescence and phase-contrast images are overlaid. (Scale bar: 1 μm.) (G) Immunofluorescent images of GFP and FtsZ OX cells showing the localization of CENP-A at hour 24 in synchronous culture. Magenta, autofluorescence of the chloroplast; green, immunostained CENP-A. The fluorescence and phase-contrast images are overlaid. (Scale bar: 5 μm.) Two independent experiments produced similar results. The results from one experiment are shown.

