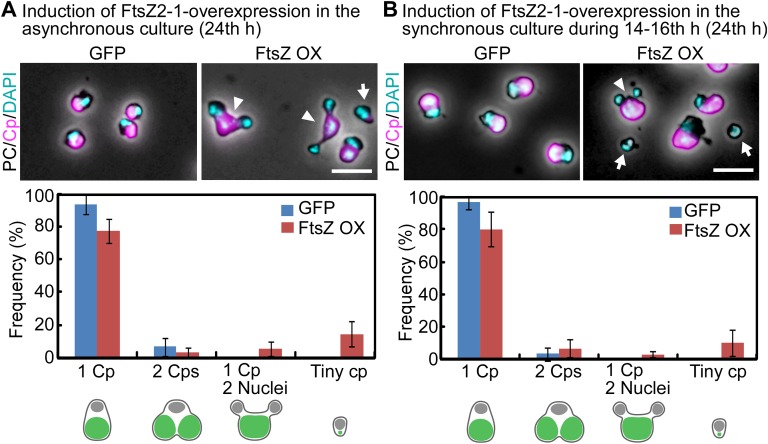
Fig. S5.
DAPI-stained images of the GFP-expressing control cells and FtsZ2-1–overexpressing cells. (A) The control GFP heat-inducible (GFP) or FtsZ2-1 heat-inducible (FtsZ OX) cells cultured asynchronously at 42 °C under light were transferred to dark. Then GFP or FtsZ2-1 from the transgene was expressed by two rounds of heat shock at 50 °C for 1 h, as shown in Fig. 2A. (Upper) DAPI-stained images of the cells at 24 h after the onset of FtsZ2-1 overexpression by heat shock. Magenta, autofluorescence of the chloroplast; cyan, DNA stained with DAPI. The images obtained by fluorescence and phase-contrast microscopy are overlaid. The arrowheads indicate cells with one chloroplast and two nuclei. The arrow indicates a cell with a tiny chloroplast remnant. (Scale bar: 5 µm.) (Lower) The frequency of each cell type in control GFP-expressing cells or FtsZ2-1–overexpressing cells. The error bars represent the SD (n = 3). (B) FtsZ heat-inducible (FtsZ OX) cells were synchronized by a 12-h/12-h light/dark cycle at 42 °C and were heat shocked at 50 °C at hour 14 (during constriction of the chloroplast division site) for 2 h, as shown in Fig. 4A. (Upper) DAPI-stained images of the cells at hour 24 in the synchronous culture. The arrowhead indicates a cell with one chloroplast and two nuclei. The arrows indicate cells with a tiny remnant of the chloroplast. (Scale bar: 5 µm.) (Lower) The frequency of each cell type in control GFP-expressing cells or FtsZ2-1–overexpressing cells. The error bars represent the SD (n = 3).

