Fig. 4.
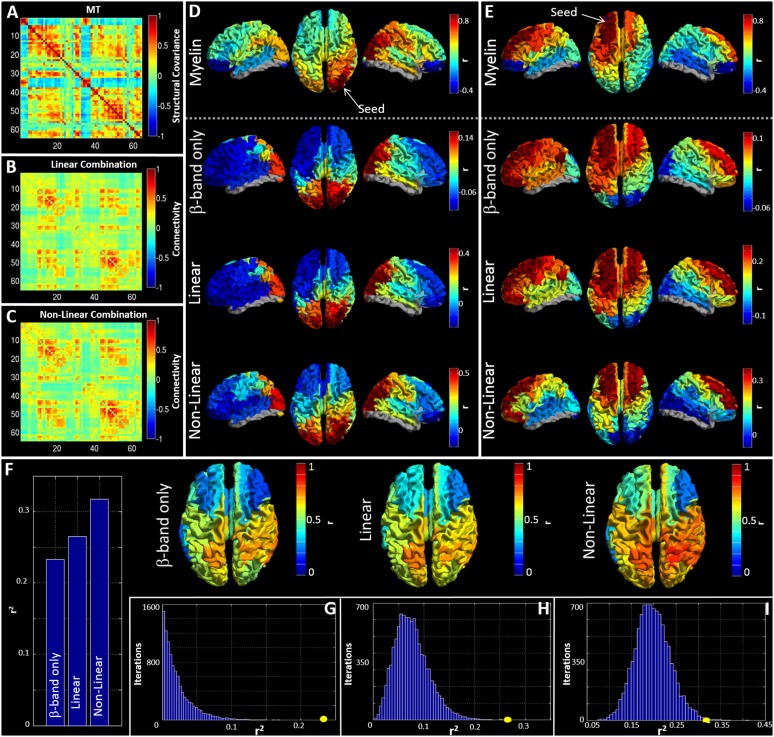
Predicting myelination based on integrated MEG networks. (A–C) Matrices representing (A) the MT network, (B) the best linear combination of MEG frequency bands to estimate MT, and (C) the best nonlinear prediction of MT. (D and E) Seed-based visualizations of structural and functional networks with seed regions in right lateral visual cortex (D) and left superior frontal cortex (E). The lower three rows show beta band and the linear and nonlinear predictions of the MT network (Top). (F) r2 values describing goodness-of-fit between structure and function for the best-fitting single frequency band (beta) and predictions based upon linear and nonlinear combinations of MEG frequency bands. The inset images show the seed regions driving these correlations. (G–I) The r2 values (circles) plotted against the null distributions for the beta band (G) linear (H) and nonlinear (I) combinations.

