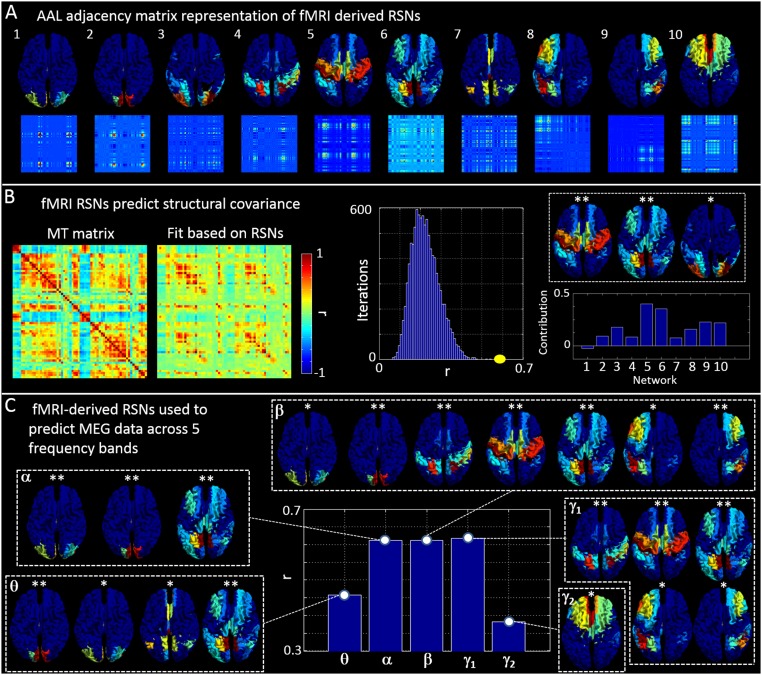
Fig. S2.
Using fMRI-derived RSNs to predict structural covariance and MEG. (A) Vector (Upper) and adjacency matrix (Lower) representations of 10 commonly observed RSNs. (B) (Left) The structural covariance (MT) matrix and a fit to that matrix based on the 10 RSNs in A. (Center) The measured correlation between the MT matrix and the fit (yellow) alongside an empirical null distribution. (Right) The fitted parameters, (bar chart) and the networks with the highest contribution. (C) (Center) Correlation between the five MEG-derived adjacency matrices (Fig. 2) and their best fit based on the 10 fMRI-derived RSNs in A. The inset images show which RSNs contribute maximally to each band.

