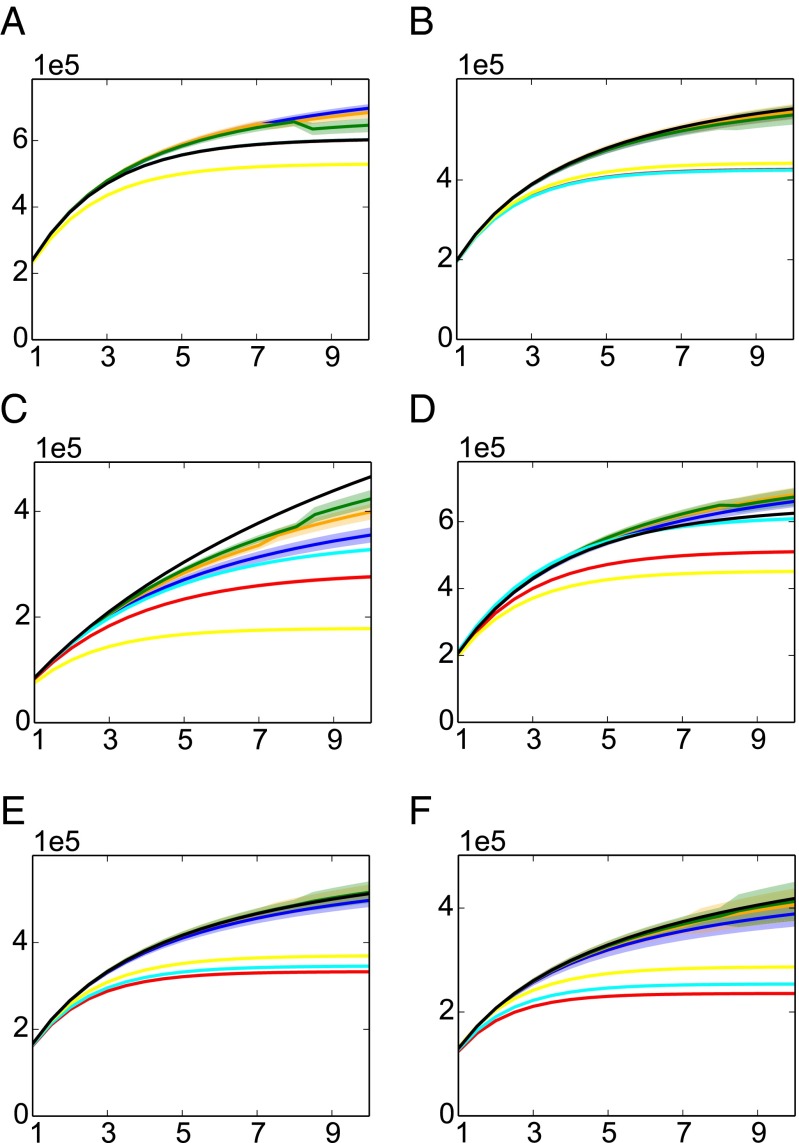
Fig. 3.
Comparisons of unseen species estimates as a function of t for six distributions (A) uniform, (B) distributions with 2 steps , (C) Zipf distribution with parameter 1 , (D) Zipf distribution with parameter , (E) Dirichlet-1 prior, (F) Dirichlet- prior. All experiments have distribution support size , , and are averaged over 100 iterations. The true value is shown in black, and estimated values are colored, with the solid line representing their means and the shaded band corresponding to one SD. The parameters of the SGT estimators are chosen based on Table 1.

