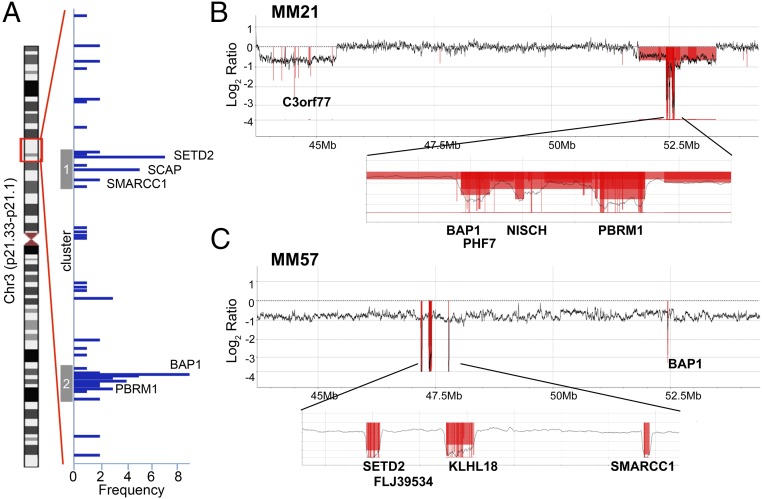
Fig. 1.
Segmental CN loss detected in 3p21 by high-density aCGH. (A) Frequency of biallelic deletion detected among 251 genes in 3p21 in 33 MMs. On the vertical-axis, genes are aligned along the genome location. The blue horizontal bars represent each of the 46 genes and the length of the bar represents the case frequency that showed biallelic deletions. (B and C) Representative profiles of CN change in MM21 and MM57, respectively. CN is shown as log2 ratio and the regions showing biallelic deletion are marked in red.

