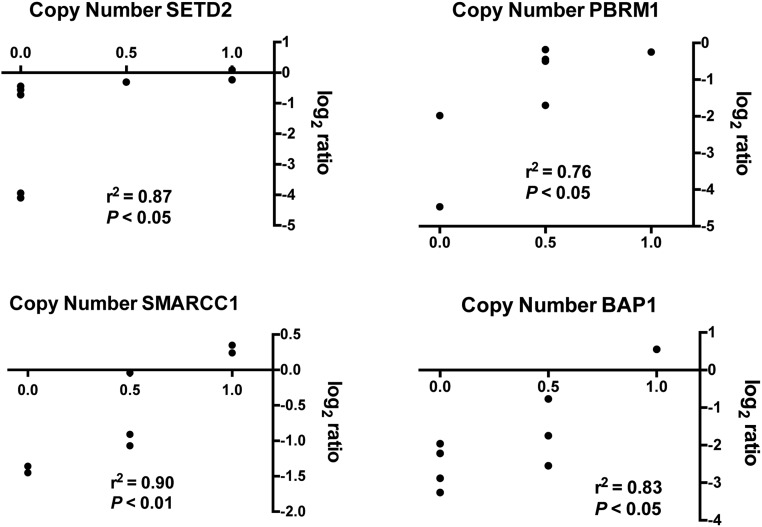
Fig. S4.
Correlation between high-density aCGH data and mRNA expression. Statistically significant correlation between high-density aCGH data and mRNA expression for SETD2, PBRM1, SMARCC1, and BAP1. For the x axis: 0.0 for biallelic deletion; 0.5 for monoallelic deletion; 1.0 for absence of CN variation. Monoallelic losses often presented intermediate levels of mRNA expression.

