Fig. 1.
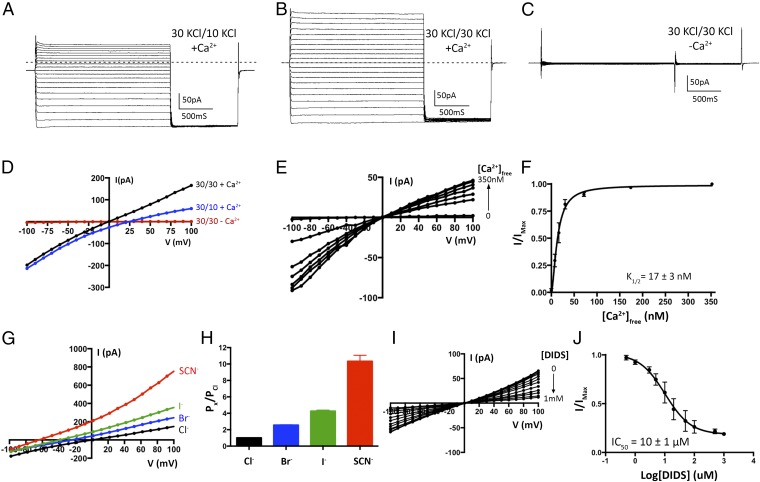
Electrical recordings of planar lipid bilayers containing purified chicken BEST1 protein. A–C are representative experiments using the same bilayer. The dashed lines represent the zero current level. (A) With ∼300 nM Ca2+ on both sides of the membrane, currents were measured using asymmetric KCl (30 mM cis and 10 mM trans) and the following protocol: from a holding potential of 0 mV, the voltage was stepped to test values between −100 and +100 mV, in 10-mV increments, for 2 s. After a further 1-s step to −100 mV, the voltage was returned to 0 mV. (B) Currents recorded using ∼300 nM Ca2+ and symmetric 30 mM KCl. (C) Currents recorded after 10 mM EGTA had been added to each side. In figures, values such as “30/10” indicate the concentrations of KCl, in millimolar, on the cis/trans sides. (D) Current–voltage (I–V) relationships of the data shown in A–C, which were obtained by plotting the test voltages vs. the average currents from 200-ms windows at the end of the 2-s pulses (connected filled circles). (E) Reactivation of BEST1 currents by increasing the free Ca2+ concentration ([Ca2+]free). After observing currents in standard symmetrical solutions, 10 mM EGTA was added to the cis side to deactivate channels with their cytosolic side facing that direction. Then, using perfusion, the [Ca2+]free in the trans solution was varied from ∼0 to 350 nM with a Ca-EGTA buffer system (Methods). I–V relationships are shown for data recorded using the same pulse protocol as A–C. (F) Ca2+ response curve. From three separate experiments as in E, average currents observed at −100 mV for different [Ca2+]free were plotted as the fraction of the current recorded at −100 mV from the [Ca2+]free = 350 nM condition (IMax). The data were fit to a one-site binding model. (G) Lyotropic series of anion permeability. After first recording using symmetric 30 mM KCl (black I–V trace), the solution on the trans side was replaced (by perfusion) with solutions containing 30 mM KBr, KI, or KSCN. I–V traces are shown for data collected using the standard voltage protocol. (H) Permeability ratios, determined using data from G by solving the Goldman–Hodgkin–Katz equation (SI Extended Data Analysis). Three separate experiments were used to compute the SE. (I and J) DIDS block. (I) I–V relationships show the decrease in current with increasing concentrations of DIDS. (J) Fit of the data from I and two analogous experiments to a standard dose–response curve. The data were plotted as the fraction of the current recorded at −100 mV in the absence of DIDS (IMax).

