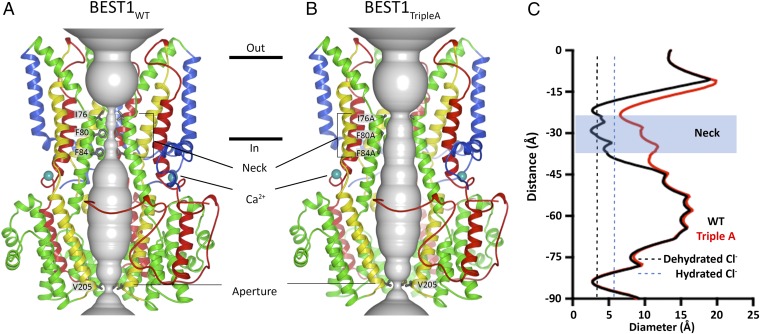
Fig. 5.
Comparison of the X-ray structures of BEST1WT (A) and BEST1TripleA (B). Ribbon representations are shown for three subunits (two in the foreground are removed for clarity). The ion pore (gray tube) is depicted as a representation of the minimal radial distance from the central axis to the nearest van der Waals protein contact. Secondary structural elements are colored according to the four segments of the channel (S1, blue; S2, green; S3, yellow; S4 and C-terminal tail, red), which contain corresponding transmembrane regions. Approximate boundaries of a lipid membrane are indicated by horizontal black lines. (C) Plots of the diameters of the pores from A and B along the ion conduction pathway. Vertical dashed lines indicate the diameters of hydrated and dehydrated Cl− ions.

