Fig. S2.
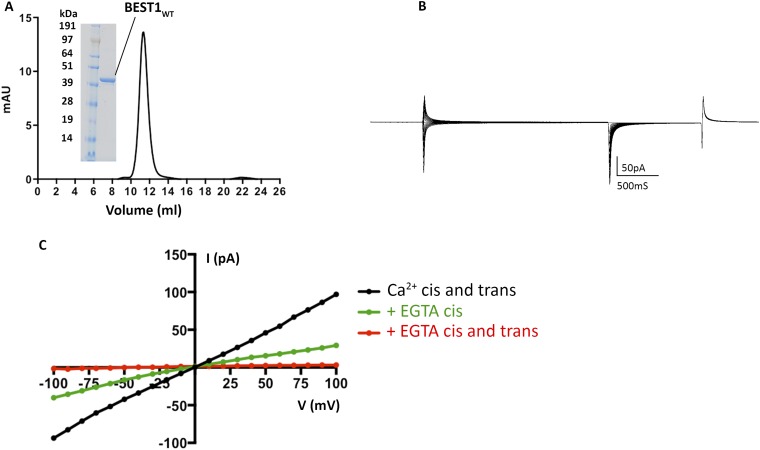
(A) Purified BEST1 protein. The elution profile of from a size exclusion column (Superdex 200; GE Healthcare; black UV trace) and SDS/PAGE analysis of the purified protein (Inset; molecular weight marker, Left; purified BEST1WT, Right) are shown. (B) Currents observed for an “empty” lipid bilayer without channels. A representative trace is shown using the same voltage pulse protocol described in Fig. 1. (C) BEST1 channels insert in both orientations in the bilayer. I–V relationships are shown for macroscopic currents recorded from bilayers containing purified chicken BEST1WT (using the same pulse protocol as in Fig. 1). The voltage is stepped to values between −100 and +100 mV under symmetrical conditions before (black; ∼300 nM Ca2+) and after addition of 10 mM EGTA to standard solutions on the cis (green) and then trans (red) sides. The stepwise reduction in currents observed by chelation of Ca2+ by EGTA on the cis and trans sides is indicative that channels are inserted in both orientations in the bilayer.

