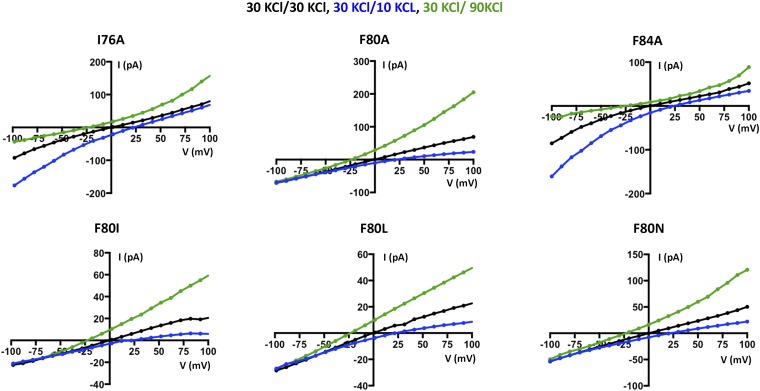
Fig. S4.
Example I–V traces for BEST1 neck mutants used to compute the permeability ratios (PK/PCl) presented in Fig. 2D. For each mutant, three separate experiments, using different bilayers, were used to compute PK/PCl. The bath solutions and pulse protocols were identical to those described in Fig. 2B.

