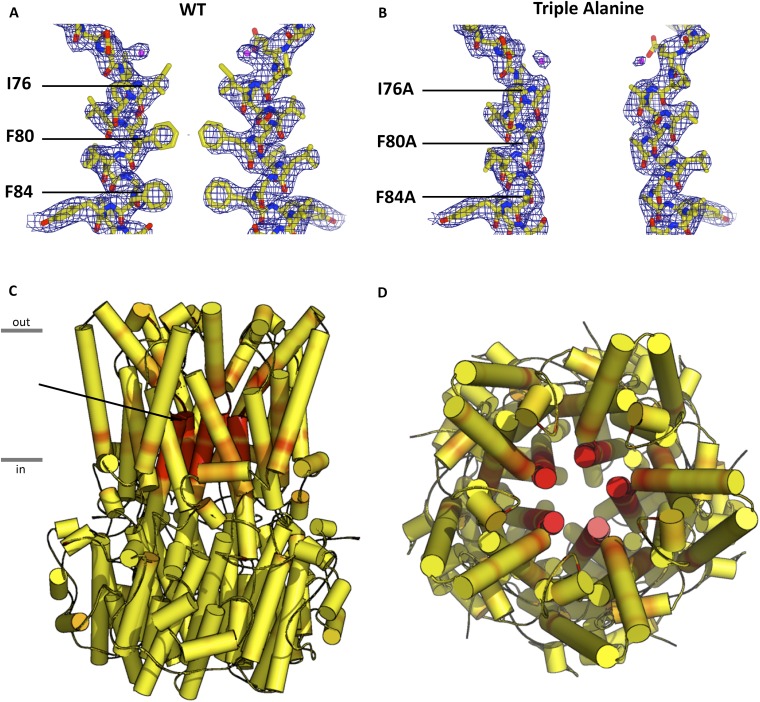
Fig. S9.
Differences at the neck in BEST1WT and BEST1TripleA. 2Fo – FC electron density is shown for the neck region for WT (A) and BEST1tripleA (B) with two subunits displayed for simplicity. The density is contoured at 1.3σ in the context of the final atomic model, which is shown as sticks and spheres (Cl− is depicted as a purple sphere). (C) Side view and (D) top view of BEST1 channel with α-helices depicted as cylinders and colored on a yellow-to-red spectrum according to the displacement of Cα atoms between the refined atomic models of BEST1WT and BEST1TripleA. Yellow color represents displacements less than 0.15 Å, and red color represents displacements greater than 0.4 Å. An arrow indicates the neck of the pore.

