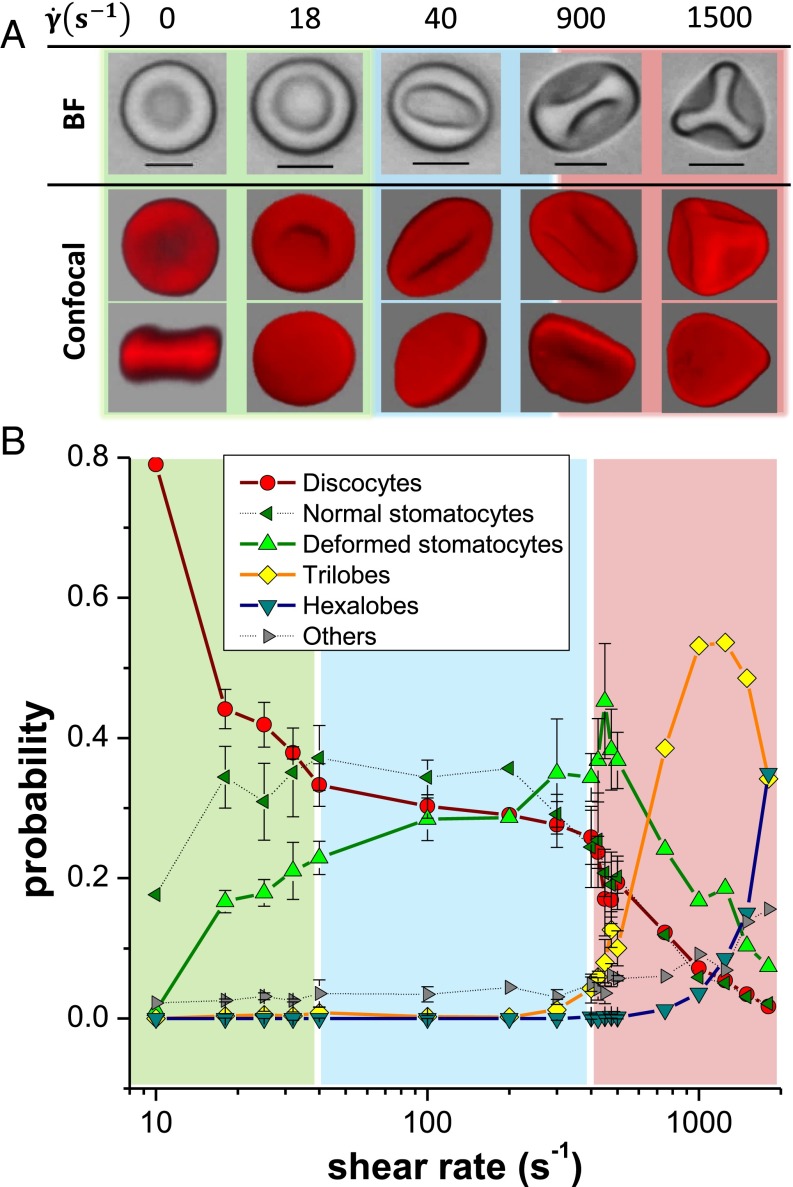
Fig. 1.
Investigation of RBC shapes at different shear rates in a cone-and-plate rheometer. (A) Observation of hardened cells by optical (black and white) and confocal (red) microscopy: With increasing the formation of highly deformed stomatocytes and then polylobed cells (trilobe and hexalobe) is detected. (Scale bars, 5 m.) (B) Shape distribution of RBC populations in samples hardened at different shear rates: the three regions in color highlight different regimes of decrease of discocyte populations. The error bars represent triplicate measurements realized in the two rapidly varying regions. They illustrate the typical variance of the measurements.

