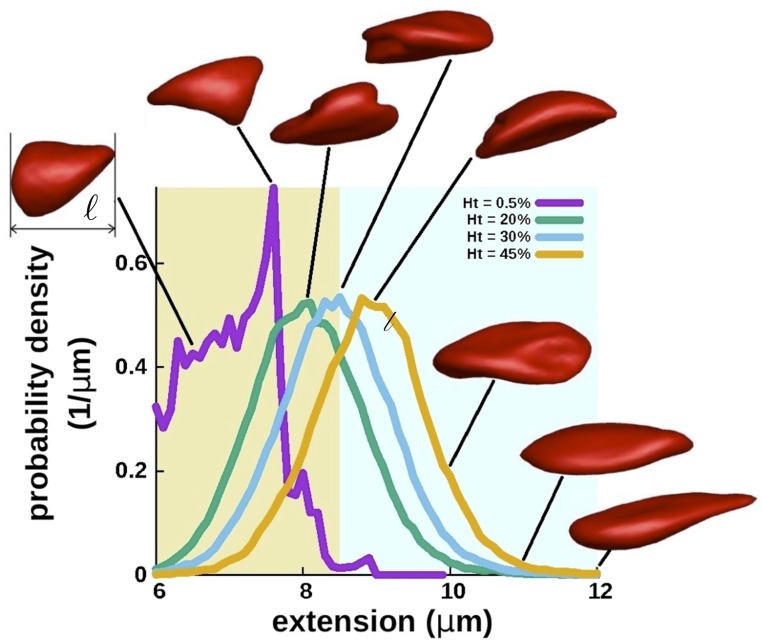
Fig. S1.
Distributions of RBC extension for different values measured in SDPD simulations. Extension is defined as the maximum instantaneous cell length in the flow direction, as depicted in the first inset. Distributions include data from multiple RBCs in a suspension and are averaged over many time instances. Insets illustrate typical shapes for different values of . The two extension regions marked by light yellow and light blue colors schematically depict ranges where polylobed shapes and creased discocytes are observed.

