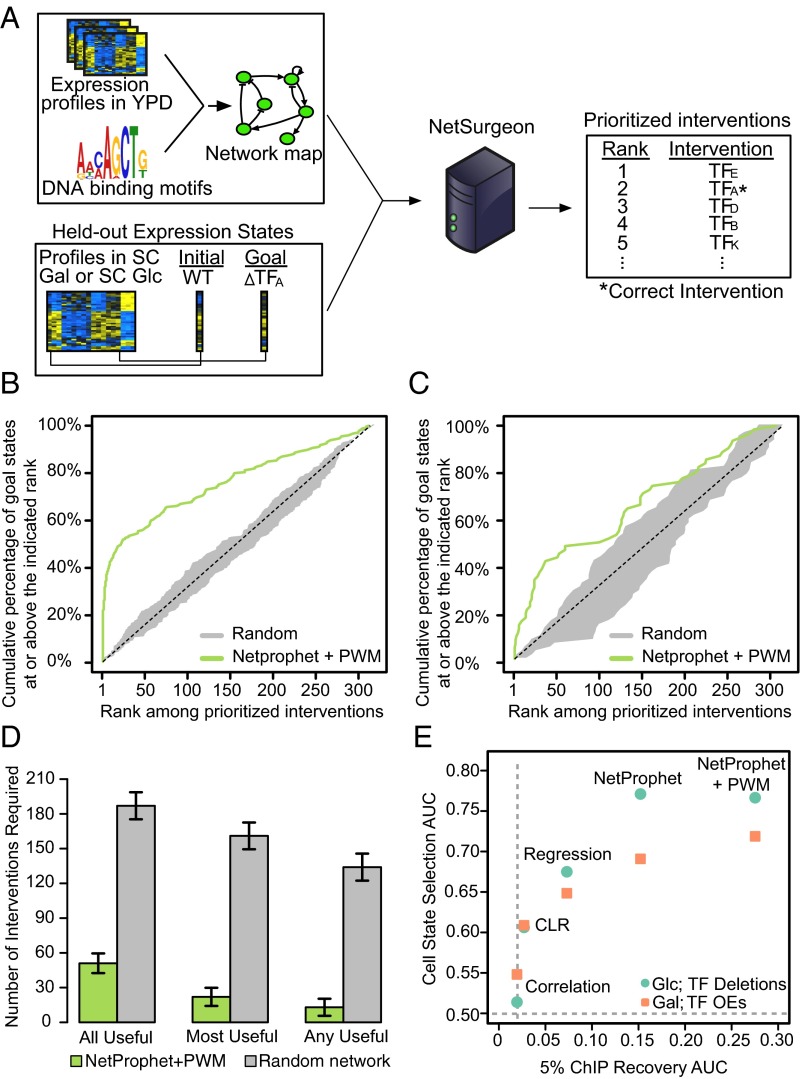
Fig. 2.
Benchmarking NetSurgeon on existing data. (A) Overview of our approach to benchmarking NetSurgeon on existing expression data. (B) Cumulative percentage of correct picks (the TFs that were actually deleted to generate the goal state profile; y axis) prioritized above the rank indicated on the x axis. The goals states were the expression profiles 245 regulator deletion mutants growing in synthetic complete medium (SC) supplemented with 2% glucose. NetSurgeon ranking using the NetProphet+PWM network map (green), NetSurgeon ranking using random permutations of the NetProphet+PWM map (gray), and the expectation for randomly ranked interventions (dotted line). (C) Same as B for goal states defined by the expression profiles of 63 TF overexpression strains growing in SC supplemented with 2% galactose. (D) Median number of top-ranked NetSurgeon interventions required to include all useful interventions, the most useful intervention, or any useful intervention (lower is better). Useful interventions are defined as those that reduce the distance to the goal state by at least 10%. The analogous numbers for randomly ranked networks are shown in gray. (E) NetSurgeon accuracy as a function of the accuracy of the input TF network map for five networks, where NetSurgeon is assessed with goal states defined by TF deletion strains in SC with glucose (green) or TF overexpression strains in SC with galactose (orange). NetSurgeon accuracy is summarized by the area under curves analogous to those shown in B and C. The accuracy of the input GRNs is assessed using ChIP-supported interactions as the gold standard and summarized by the area under the precision recall curve from 0% to 5% recall (SI Materials and Methods).

