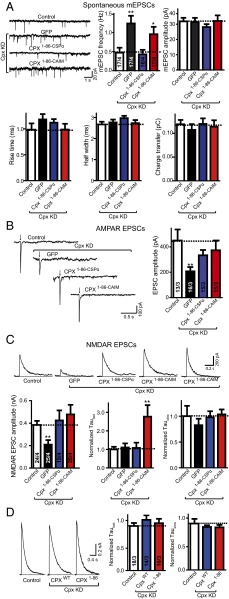
Fig. 3.
Mislocalization of Cpx to the plasma membrane affects NMDAR EPSCs. (A) Sample trace (Upper Left) and summary graphs of the frequency and amplitude (Upper Right), and kinetics (Lower) of mEPSCs, recorded in cultured cortical neurons that were infected with a control lentivirus (control) or lentiviruses expressing complexin shRNAs (GFP) without or with coexpression of Cpx1–86–CSPα or Cpx1–86–CAIM. Neurons were infected on DIV 4–6, and analyzed on DIV 14–16. Recordings were performed in 50 μM AP-5, 100 μM picrotoxin and 1 μM tetrodotoxin. (B) Sample traces (Left) and summary graphs of the amplitude (Right) of action-potential–evoked AMPAR-mediated EPSCs monitored in control or Cpx-deficient cortical neurons as described for A, except that tetrodoxin was omitted. (C) Sample traces (Upper), summary graphs of the amplitude (Lower Left), normalized τfast decay time (Lower Center) and normalized τslow decay time (Lower Right) of action-potential–evoked NMDAR-mediated EPSCs monitored in control or Cpx-deficient cortical neurons as described for A. For Cpx1–86–CAIM two sample traces were included to illustrate the degree of variability. (D) Sample traces (Left) and summary graphs of τfast decay time (Center) and τslow decay time (Right) of action-potential evoked NMDAR-mediated EPSCs monitored in cultured cortical neurons that were infected with a control lentivirus (control) or lentiviruses expressing Cpx shRNAs with coexpression of wild-type complexin1 (CpxWT) or C-terminal truncated mutant Cpx (Cpx1–86). The decay times were normalized to control. Recordings were performed in 20 μM CNQX and 100 μM picrotoxin. Data shown in summary graphs are means ± SEM; numbers of cells/independent cultures analyzed are listed in the bars. Statistical assessments were performed by the Student’s t test comparing each condition to the indicated control experiment (*P < 0.05, **P < 0.01).

