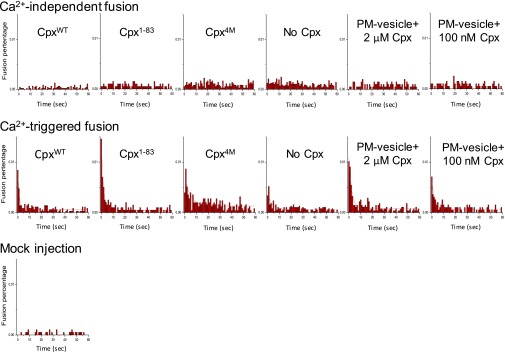
Fig. S1.
Data figure for Figs. 1 and 5. Experiments were performed in the presence of both full-length synaptotagmin-1 and neuronal SNAREs, and in the absence or presence of 2 μM Cpx, Cpx fragment, or Cpx mutant as well as preincubation of tethered PM vesicles in the presence of 2 μM and 100 nM Cpx. The Ca2+-independent fusion histograms and the 500 μM Ca2+-triggered fusion histograms (1-s time bins) were cumulated over the 1-min acquisition period for all rounds and repeat experiments and then normalized with respect to the number of analyzed SV–PM vesicle pairs (Methods). The Ca2+-triggered fusion histograms were fit to an exponential decay function and the resulting decay rates are shown in the “Ca2+-triggered fusion synchronization” bar charts in Figs. 1 and 5. The numbers of independent repeat experiments and analyzed SV–PM vesicle pairs are provided in Table S1.

