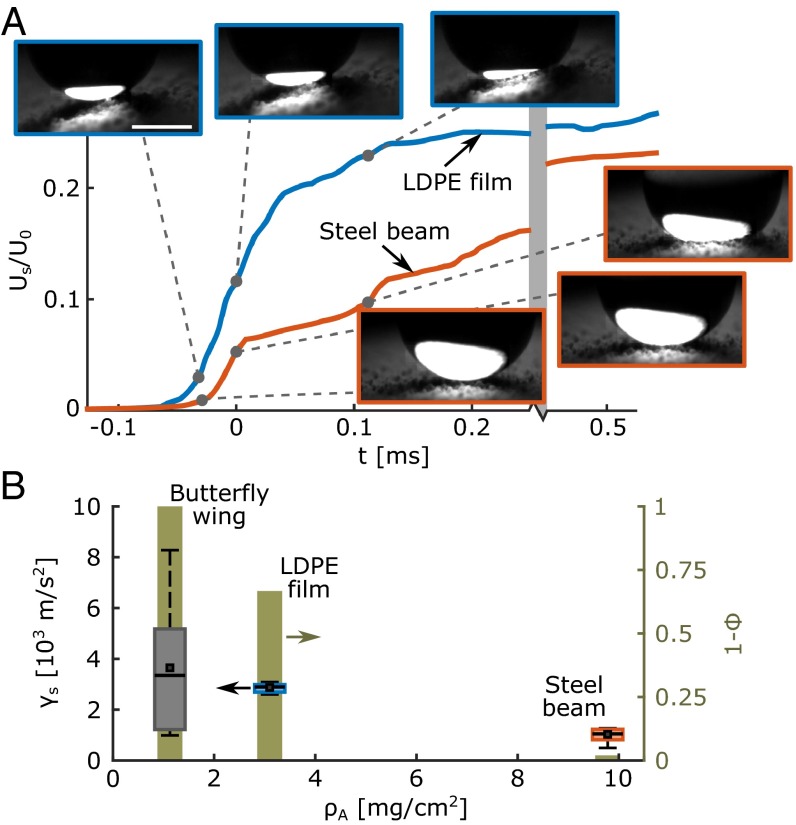
Fig. 2.
Substrate velocity and acceleration during impact. (A) Normalized substrate velocity profile () versus time as recorded by the laser vibrometer at the early stages of the impact event ( 2.35 mm, 50) for the LDPE film (blue) and steel beam (red). Time zero is set to the instance of contact. Both surfaces are treated with coating nC1. (Insets) Snapshots for three time instances, just before contact, at 0, and at 112 µs. (Scale bar, 1 mm.) (B) Mean substrate acceleration (, box plot corresponding to the left axis) just before the moment of impact and probability of total rebound (, bar plot corresponding to right axis) versus substrate areal density (), for the same impact conditions as in A. Box spans from the first to third quartile with Tukey style whiskers, bold lines indicate population medians, and square markers denote the population means. Sample size () is 5 repetitions per substrate for estimating and 24 repetitions per substrate for estimating .

