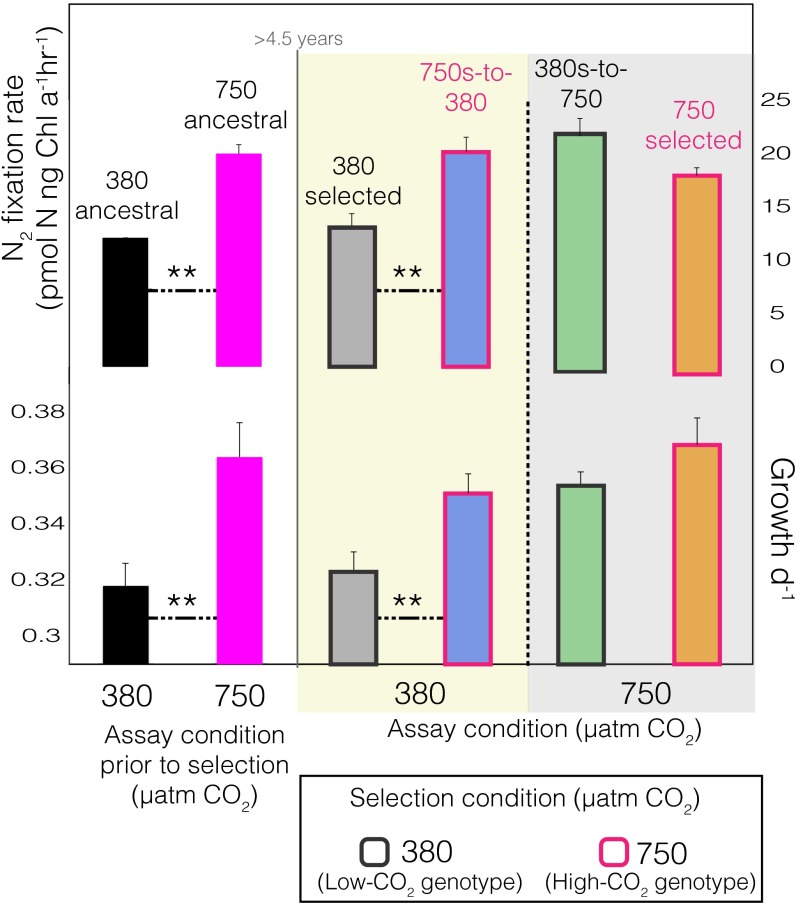
Fig. 1.
Growth (Lower) and N2 fixation (Upper) rates of the ancestral and CO2-selected cultures before and after 4.5 y of selection, respectively. The assay condition is denoted on the x-axis, and the selection condition is denoted by the colors of the bar border. The bar colors denote the different experimental treatments that are indicated above each bar. Assays done after 4.5 y of long-term CO2 selection are denoted after the gray solid vertical line. The yellow background denotes the 380-µatm CO2 assay condition, and the gray background denotes that of the 750-µatm CO2. Statistically significant differences were determined by two-way ANOVAs (selection x assay conditions) followed by Tukey’s HSD post hoc tests. Asterisks denote statistical significance between two respective treatments. **P ≤ 0.01. Error bars are SEs of six biological replicate cultures.

