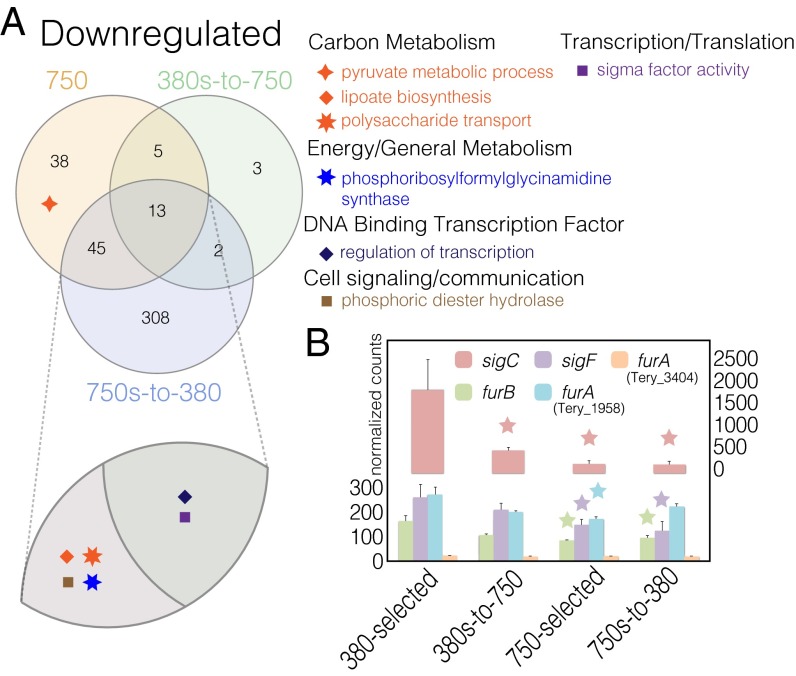
Fig. 2.
Shown are down-regulated GO-enriched pathways relative to 380-selected and transcriptional profiles of sigma factors, sigC and sigF as well as Fur proteins. (A) Down-regulated GO-enriched pathways for the all high-CO2 phenotype treatments. (B) Differential expression of transcriptional regulators with stars representing statistical significance relative to the 380-selected and error bars being SEs.

