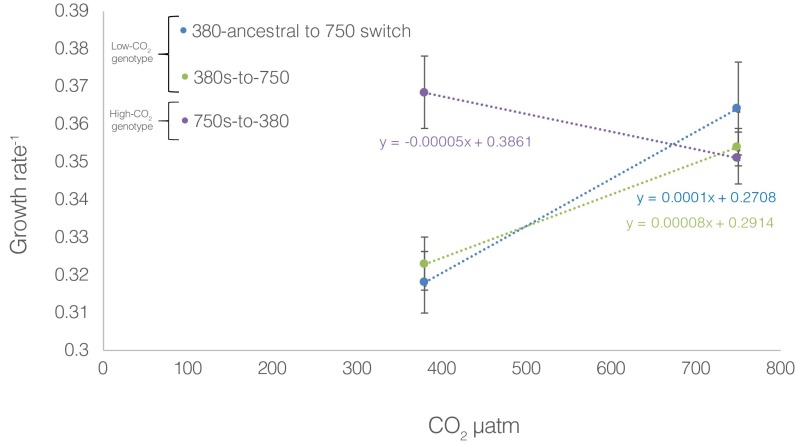
Fig. S1.
Growth rate slopes for three separate, short-term switch experiments where growth rate was measured after ∼5 generations of acclimation to the new environment. The “380-ancestral to 750 switch and the 380s-to-750” are the low-CO2 selected cell lines and the “750s-to-380” are the high-CO2 selected cell lines.

