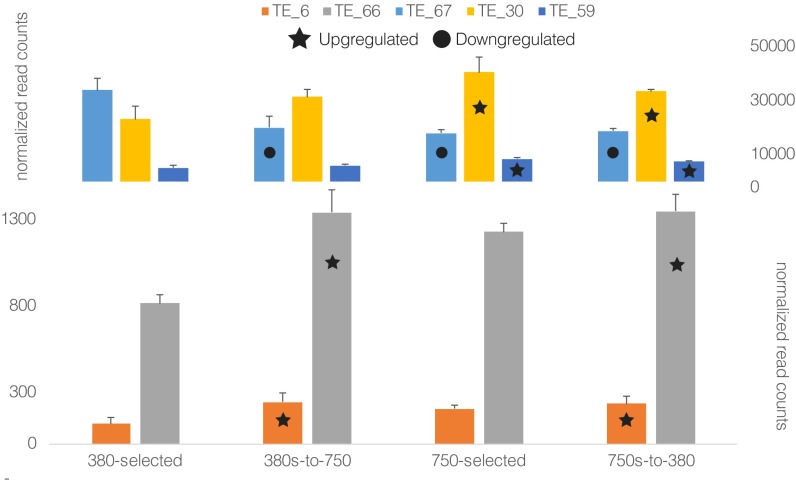
Fig. S2.
Bar graph of select TE clusters that shared significantly different (edgeR; SI Materials and Methods) mean expression profiles between at least two high-CO2 phenotype treatments relative to the 380-selected cell lines. Stars represent statistically significant up-regulation and circles down-regulation. Error bars are SEs.

