Fig. 1.
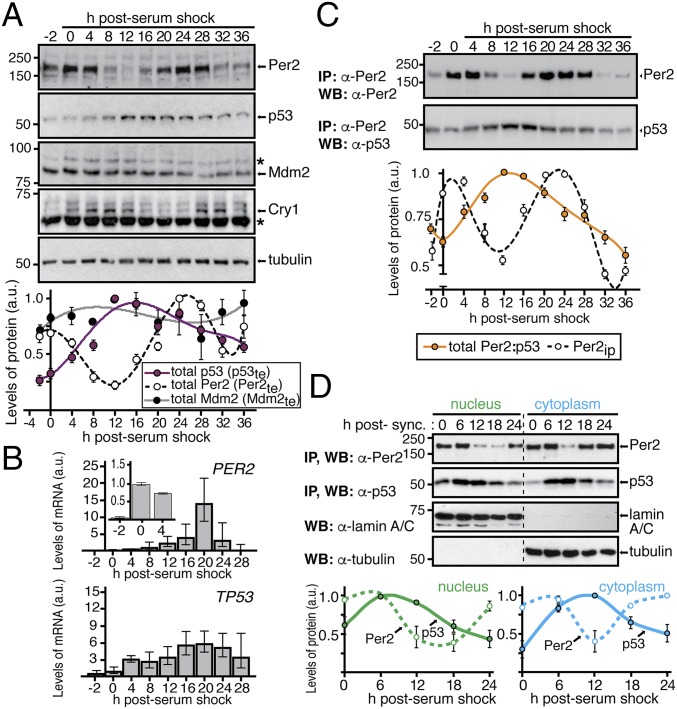
Distinct p53 and Per2 phases characterize their time-dependent subcellular distribution. (A, Upper) Extracts from circadian synchronized HCT116 cells were analyzed for the expression of endogenous Per2, p53, Mdm2, and Cry1 by immunoblotting. Asterisks indicate nonspecific bands. (Lower) Bands were quantified using ImageJ, and values were normalized to tubulin levels. Data are in arbitrary units (a.u.). (B) Samples from A were processed for qRT-PCR as described in SI Materials and Methods. Data for PER2 and TP53 gene expression are shown as the mean ± SEM from three independent experiments performed in triplicate. Bar graphs are fold increase normalized to the level of expression at t = 0 h. Inset indicates level of Per2 expression within the first 4 h. (C) HCT116 extracts from various times postcircadian synchronization (t = 0–36 h) were immunoprecipitated using α-Per2. Bound proteins were identified by immunoblotting and quantified as described in A. Relative amounts of Per2 and total Per2:p53 complex were plotted in arbitrary units relative to t = 0. (D) Nuclear and cytoplasmic fractions from circadian synchronized HCT116 cells were enriched for endogenous Per2 and p53 by immunoprecipitation and blotted using α-Per2 or -p53 antibodies, respectively. Tubulin and lamin A/C were used as controls. Bands were quantified and plotted as in A. In A, C, and D, immunoblot data were originated from a single experiment that was repeated three times with similar results. Error bars represent mean ± SEM.

