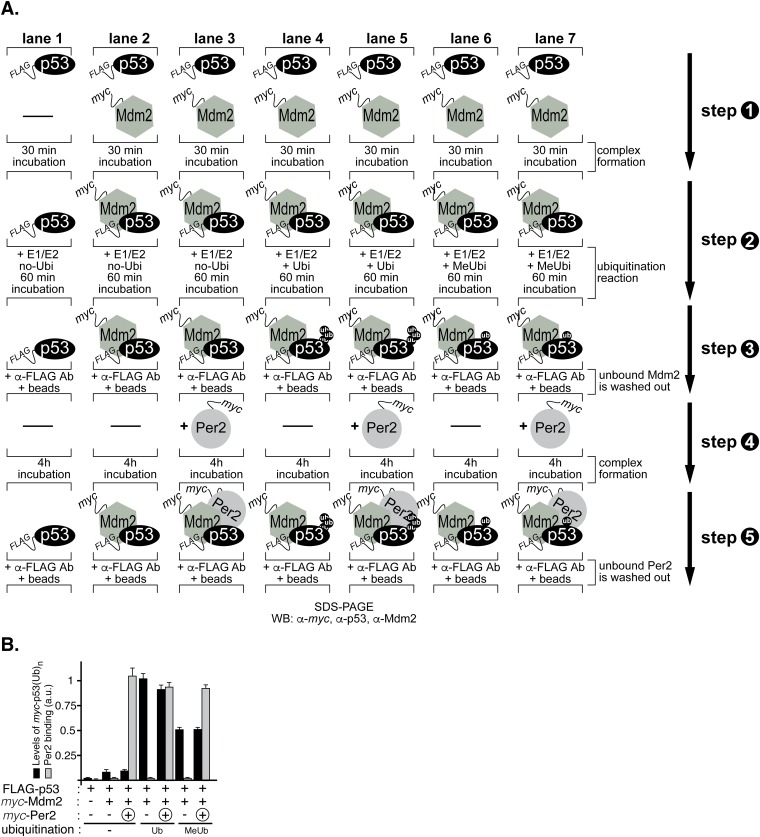
Fig. S5.
Analysis of Per2 association to various ubiquitinated forms of p53. (A) A schematic representation of the steps in the ubiquitination protocol detailed in Materials and Methods and used to generate the data summarized in Fig. 4 and Fig. S5B. (B) Bands from Fig. 4 were quantified as described and values plotted in arbitrary units (a.u.). In all cases, bars indicate levels of ubiquitinated p53 (black) and bound Per2 (gray) in the complex. Error bars represent mean ± SEM of three independent experiments.

