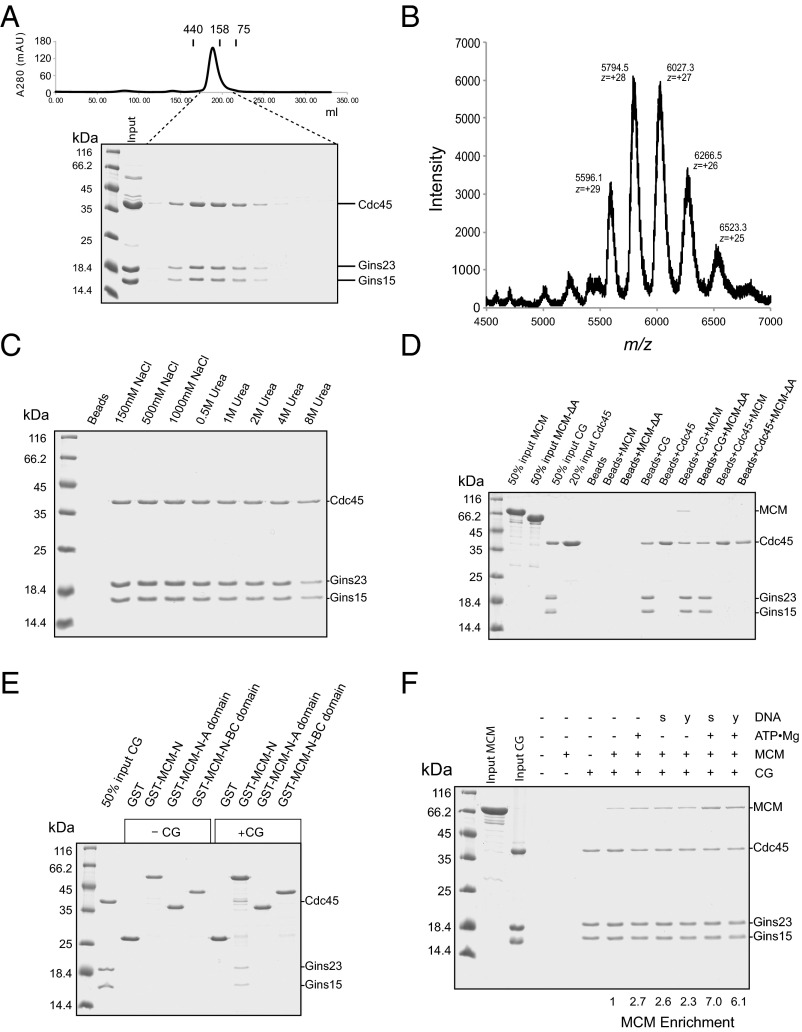
Fig. 4.
(A) Gel filtration analysis of the reconstituted recombinant CG complex. The CG complex was analyzed by gel filtration on a Superdex 200 26/60 column. The UV absorption profile is shown with the positions of elution of 440, 158, and 75 kDa size standards (ferritin, aldolase, and conalbumin, respectively) indicated. (Bottom) SDS PAGE analysis of the corresponding fractions. (B) Native electrospray ionization mass spectrometry profile for the CG complex. The peak at m/z = ∼5,794.5 has a charge of +28. (C) Stability of the CG complex: 11 µg CG complex immobilized on Ni-NTA beads were washed four times with 500 µL TBS (10 mM Tris at pH 8.0, 150 mM) or TBS supplemented with NaCl or urea to the indicated concentration. The bead-retained material was analyzed by SDS/PAGE and proteins stained with Coomassie Brilliant Blue. (D) Pulldown assays to test for interaction between 13 µg Cdc45 or the CG complex immobilized on Ni-NTA via the His-tag on Cdc45 and 18 µg MCM or MCM-ΔA. (E) Interactions between the N-terminal domains of MCM and the CG complex. Glutathione sepharose beads bound to GST, GST-fused to MCM-N (residues 1–265), MCM-N-A domain (residues 1–104), or MCM-N-BC (residues 105–265) were incubated with 13 µg CG complex. After incubation and washing, bead-retained material was examined by SDS PAGE. (F) Ni-NTA pulldown assays with the indicated combination of CG complex, MCM, and ATP•Mg (2 mM final) and 20 µM single-stranded (s) or 10 µM Y-shaped DNA (y) (the distinct concentrations were to ensure same bulk amount of DNA per reaction). The relative enrichment of MCM was calculated by measuring band intensity of MCM, using ImageJ, and normalizing to the Cdc45 band intensity.

