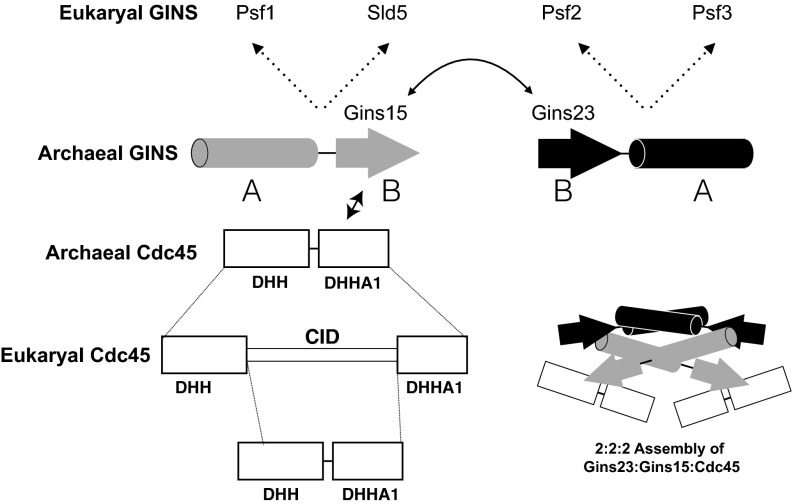
Fig. 6.
Evolutionary relationships and interactions between archaeal/eukaryotic GINS and Cdc45. Physical interactions between components are shown as double-headed solid arrows. Evolutionary relationships are shown as dotted lines. The diagram in the lower right provides a model for the 2:2:2 assembly of Gins23:Gins15:Cdc45, with the two copies of Cdc45 interacting with distinct Gins15 subunits via the latter’s B domain.

