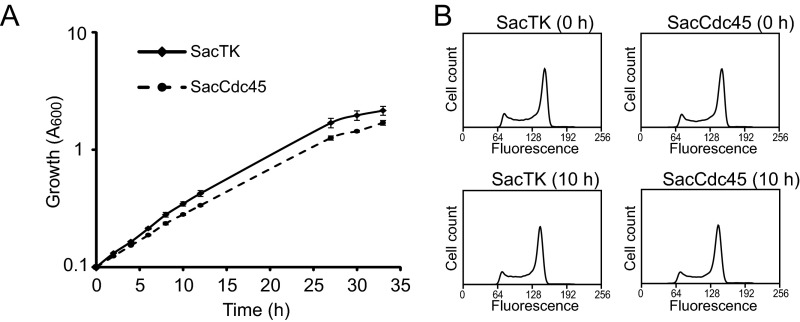
Fig. S1.
Monitoring growth of SacCdc45 cells. (A) SacTK (solid line) and SacCdc45 (dashed line) cells were grown at 75 °C with shaking at 300 rpm, and growth was monitored by measuring absorbance at 600 nm. (B) Cell cycle analysis of SacCdc45. Flow cytometry analysis was performed throughout growth; shown are samples of SacTK and SacCdc45 taken at 0 and 10 h.

