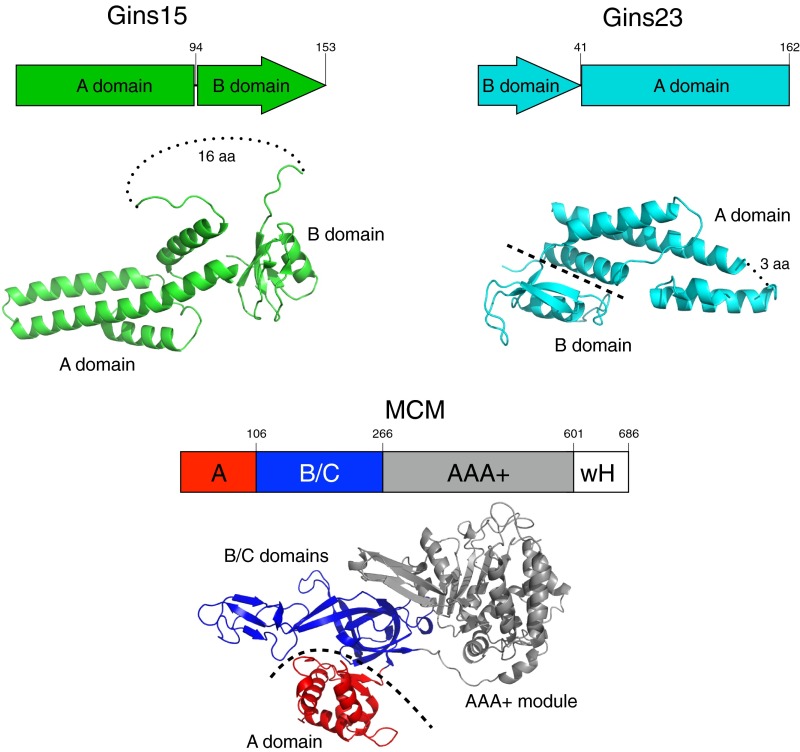
Fig. S2.
Representations and crystal structures of the domain organization of GINS subunits and MCM. Figures of the crystal structures were generated from PDB files 3ANW (T. kodakarensis GINS complex) and S. solfataricus MCM, the structure lacks the C-terminal wH domain. Dotted lines indicate missing density in the crystal structure, and dashed lines serve to highlight the boundaries between domains (15, 27).

