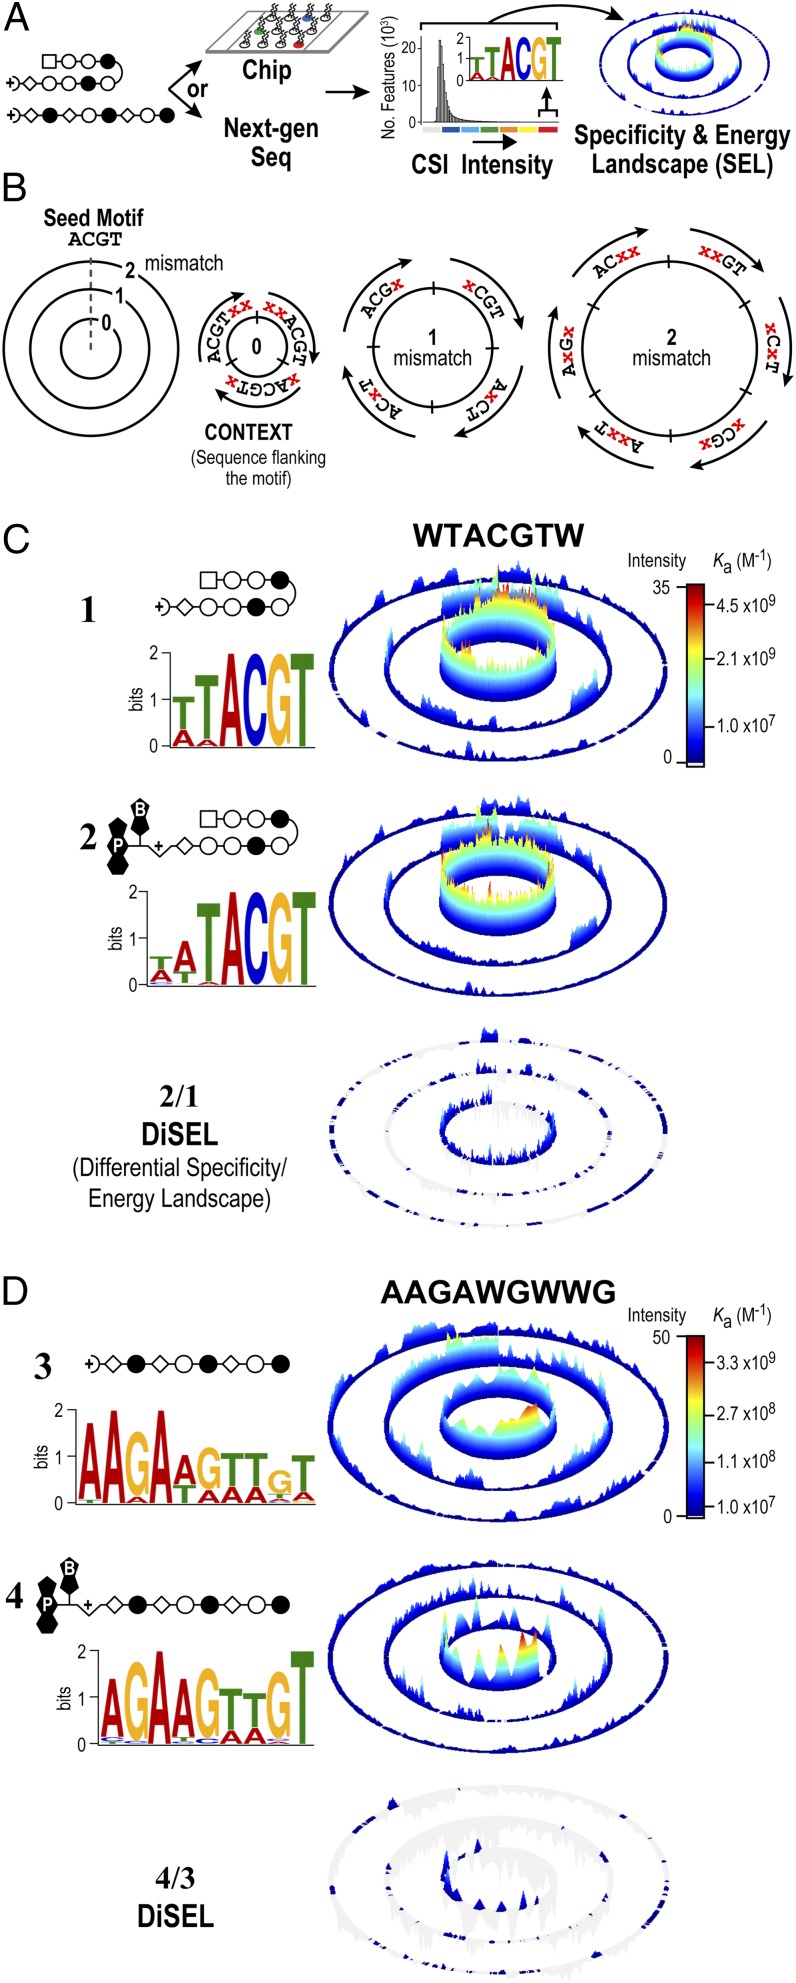
Fig. 2.
Comprehensive sequence specificity landscapes of synthetic genome readers. (A) Workflow to generate CSI sequence SELs. Specificity data can be derived by two different methods. A DNA microarray contains approximately half a million spatially resolved features that each display a unique sequence as a DNA hairpin, with all sequence variants of DNA, up to 12 bp, represented on the array (20–22). Polyamides are added to the microarray to obtain intensity values simultaneously for every DNA sequence. Alternatively, a library of DNA with all possible N-mers (e.g., 1012 unique 20-mers) can be added to a polyamide in solution (22). The polyamide–DNA interactions can be captured with an affinity handle to the polyamide (e.g., biotin/streptavidin), with the DNA amplified by PCR and sequenced with NGS (31). (B) Organization of a model SEL (21, 22, 63). The recognition preferences of DNA-binding molecules are displayed with SELs. A seed sequence (4 bp) is used to organize a dataset composed of all possible 6-mer combinations. (C and D) DNA logos and SELs reveal that the psoralen moiety has little impact on sequence specificity. Hairpin (C) and linear (D) polyamides with and without the psoralen moiety attached are shown. Scale bars show quantile-normalized CSI intensities. The difference between the two SELs is plotted as a DiSEL. Sequences preferred by 2 and 4 appear as colored peaks in the DiSELs of C and D, respectively.

