Fig. 4.
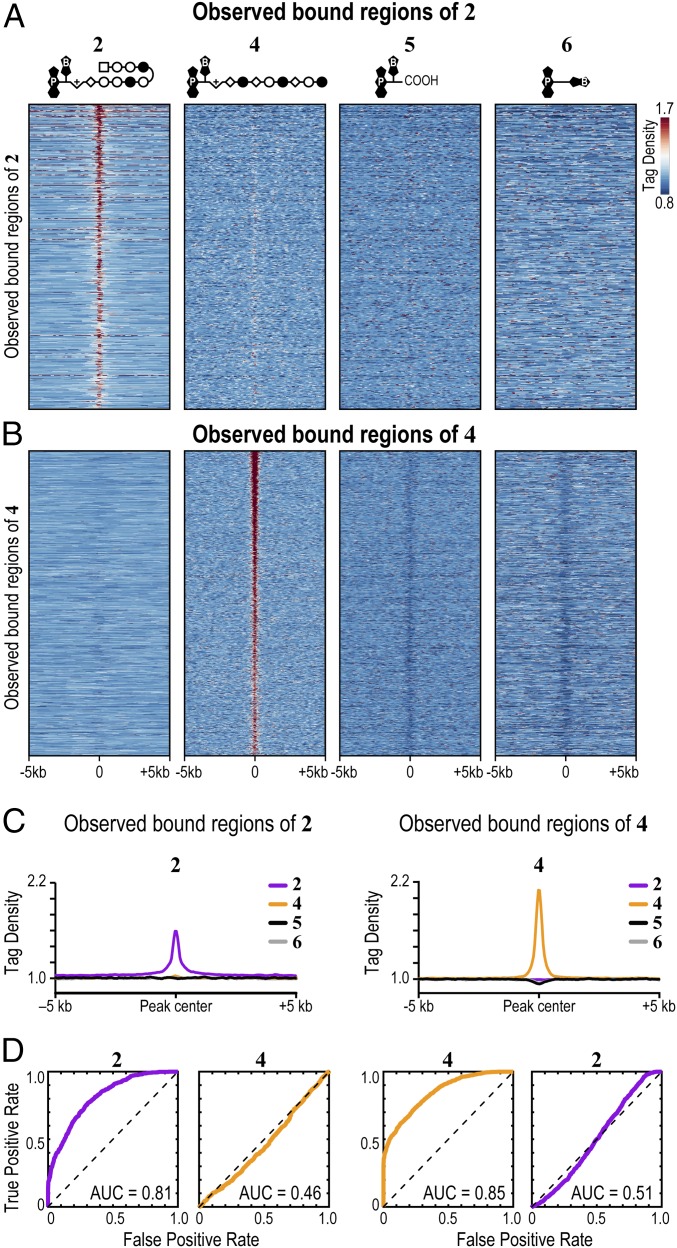
Observed bound regions of 2 and 4 show specific enrichment at loci explained by CSI-genomescapes. (A) COSMIC signals from 4, 5, and 6 show no pattern of overlap with loci bound by 2. (B) COSMIC signals from 2, 5, and 6 show no pattern of overlap with loci bound by 4. (C) Specific enrichment of polyamides at bound regions shown by metagene analysis. Psoralen analogs 5 and 6 are not enriched at polyamide-bound regions. The average signal from biological duplicates in 50-bp bins is shown. (D) Bound regions of 2 and 4 are explained by the SOS model. ROC curves of bound regions for 2 and 4 are shown. CSI-derived specificity data of 4 failed to explain binding patterns of 2, and vice versa. The area under the ROC curve (AUC) quantifies the degree to which the SOS model could distinguish bound regions from unbound regions. AUC = 0.5 represents no accuracy, whereas AUC = 1.0 represents perfect accuracy.

