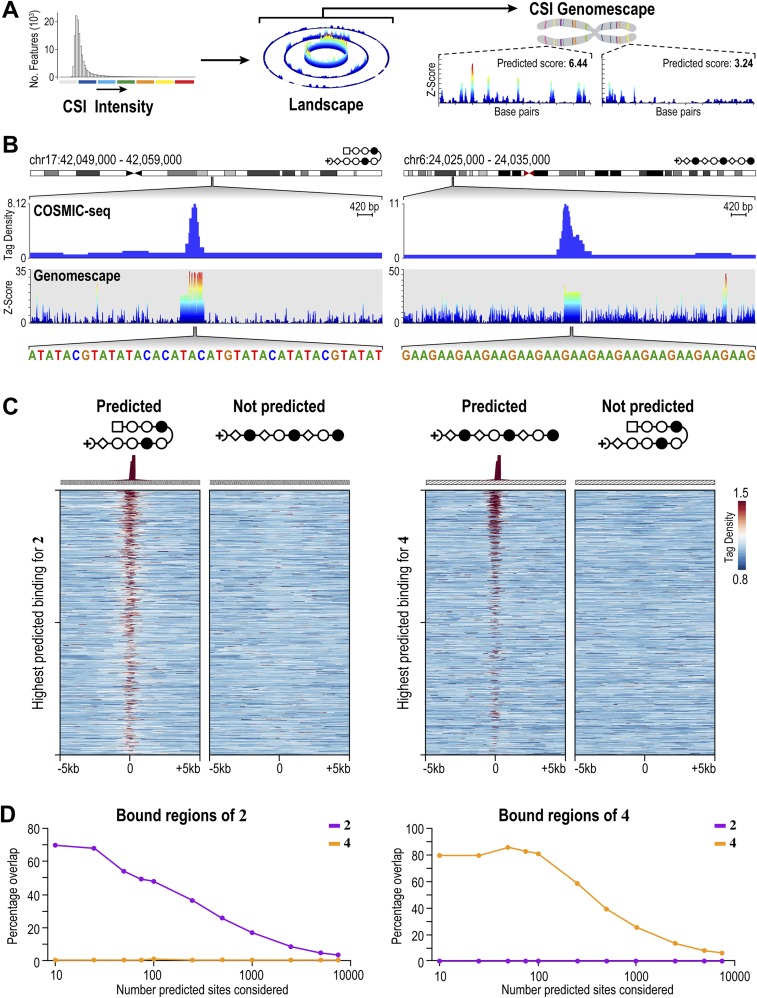
Fig. S6.
Genome-wide distribution of 2 and 4 at 20 nM shows polyamides bind to loci predicted by genomescapes. (A) Process to generate genomescapes. Genomescapes are generated by assigning an intensity to every 10-bp sequence in the genome from the CSI-SEL data. (B) Examples of 2 and 4 binding loci predicted by genomescapes. Signal tracks show the occupancy of 2 and 4. Tag density is plotted on the y axis (normalized to input DNA and 107 tags). Genomescapes of each polyamide are shown below the COSMIC tracks. (C) Heat maps reveal the selective enrichment of 2 and 4 at top predicted loci. We predicted binding of 2 and 4 to each locus in the genome with a model that incorporates clustered binding, designated the “summation model” (31). (Left) Tag density of each polyamide is shown for the top 1,000 nonoverlapping predicted hairpin loci. (Right) Tag density of each polyamide is shown for the top 1,000 nonoverlapping predicted linear loci. (D) Comparison of the top predicted sites with the bound regions of 2 and 4.

